____________________________________________________________________________________
____________________________________________________________________________________

____________________________________________________________________________________
4) Proposed maximum aggregate value of transaction:
____________________________________________________________________________________
5) Total fee paid:
[_] Fee paid previously with preliminary materials:
[_] Check box if any part of the fee is offset as provided by Exchange Act Rule0-11(a)(2) and identify the filing for which
the offsetting fee was paidpreviously. Identify the previous filing by registration statement number,or the form or
schedule and the date of its filing.
____________________________________________________________________________________
1) Amount previously paid:
2) Form, Schedule or Registration Statement No.:
____________________________________________________________________________________
3) Filing Party:
4) Date Filed:
PROXY
PROXY STATEMENT
AND
2006 ANNUAL REPORT
________
![]()
| Fiscal Year | | 2005 (1) | | 2004 (1) | | Percent Change (2) | ||||||||
|---|---|---|---|---|---|---|---|---|---|---|---|---|---|---|
| Sales | $ | 60,553 | $ | 56,434 | 7.3 | % | ||||||||
| Operating Profit | $ | 2,035 | $ | 843 | 141.4 | % | ||||||||
| Net earnings (loss) per share | $ | 1.31 | $ | (0.14 | ) | N/A | ||||||||
| Average shares used in calculation | 731 | 736 | (0.7 | )% | ||||||||||
| Net cash provided by operating activities | $ | 2,192 | $ | 2,330 | (5.9 | )% | ||||||||
| Capital expenditures | $ | 1,306 | $ | 1,634 | (20.1 | )% | ||||||||
| Identical supermarket sales (3) | $ | 54,143 | $ | 51,413 | 5.3 | % | ||||||||
| Identical supermarket sales excluding supermarket fuel operations (3) | $ | 50,866 | $ | 49,154 | 3.5 | % | ||||||||
| Comparable supermarket sales (4) | $ | 55,607 | $ | 52,514 | 5.9 | % | ||||||||
| Comparable supermarket sales excluding supermarket fuel operations (4) | $ | 52,200 | $ | 50,226 | 3.9 | % | ||||||||
| FINANCIALHIGHLIGHTS | ||||||||
| (in millions except per share data and percentages) | ||||||||
| Percent | ||||||||
| Fiscal Year | 2006 | 2005 | Change (1) | |||||
| Sales | $ | 66,111 | $ | 60,553 | 9.2 | % | ||
| Operating Profit | $ | 2,236 | $ | 2,035 | 9.9 | % | ||
| Net earnings per share | $ | 1.54 | $ | 1.31 | 17.6 | % | ||
| Average shares used in calculation | 723 | 731 | (1.1 | )% | ||||
| Net cash provided by operating activities | $ | 2,351 | $ | 2,192 | 7.3 | % | ||
| Capital expenditures | $ | 1,683 | $ | 1,306 | 28.9 | % | ||
| Identical supermarket sales (2) | $ | 59,592 | $ | 55,993 | 6.4 | % | ||
| Identical supermarket sales excluding fuel operations (2) | $ | 55,399 | $ | 52,483 | 5.6 | % | ||
| Comparable supermarket sales (3) | $ | 61,045 | $ | 57,203 | 6.7 | % | ||
| Comparable supermarket sales excluding supermarket fuel operations (3) | $ | 56,702 | $ | 53,622 | 5.7 | % | ||
| (1) |
| The percent calculations were based on the rounded numbers as presented. |
| We define a supermarket as identical when the store has been in operation and has not been expanded or relocated for five full quarters. Annualized identical supermarket sales are calculated as a summation of four quarters of identical sales. |
| We define a supermarket as comparable when the store has been in operation for five full quarters, including expansions and relocations. Annualized comparable supermarket sales are calculated as a summation of four quarters of comparable sales. |
 COVER PRINTED ON RECYCLED PAPER

Our results in 2006 clearly demonstrate that our Customer 1st strategy is working. We are focused on target and that, in implementing this strategy,listening to our people will continue to delight Customers and growoffering what they tell us is important to them. Whether it is faster checkouts, cleaner stores, more convenience or better value, each of us contributes to putting the Customer 1st every day, in every store. This is the foundation of our business.
REVIEWOF 2006
Kroger delivered consistently strong results in 2006, exceeding our original guidance for both identical supermarket sales and earnings per share growth.
QUARTERLY DIVIDEND INCREASED
On March 15, 2007, Kroger announced that our Board of Directors increased the quarterly dividend it pays shareholders by 15.4% to $0.075 per share. This strategy deploys cash to grow and maintainis the first increase in the quarterly dividend since the Board initiated the dividend program last year.
In keeping with the objectives outlined when the dividend policy was initiated, Kroger’s Board increased the amount after considering the Company’s asset base, reduce debt,overall results, the needs of the business and return valuethe interest of shareholders. This increase in the quarterly dividend reflects the Board’s confidence in our strategic plan.
IDENTICAL SALES GREW 5.6% WITHOUT FUEL
Our full-year identical supermarket sales growth in 2006, excluding fuel sales, was 5.6% – well in excess of our original goal, which was to shareholders through stock repurchases and now payment of a dividend.
EARNINGS PER SHARE GROWTHOF 15%
We ended the year with earnings per share growth of 15%, plus the additional value of our cash dividend program, far surpassing our original estimate of 6 – 8% growth in 2006. We raised that range to 8 – 10% during the year.
1
Our earnings per share growth was driven primarily by three factors: strong identical sales, slightly improving operating margins, and fewer shares outstanding.
Net earnings for the year were $1.1 billion, or $1.54 per diluted share. The 53rd week in the fiscal year provided an estimated benefit of $0.07 per diluted share.
COMPETITIVEADVANTAGES
As the retail food industry evolves, one certainty remains: the environment in which we initiatedoperate continues to be intensely competitive. We remain focused on our financial triple play strategy in January 2000, Kroger has reduced total debt by $1.8 billion and invested $3.0 billion to repurchase 155.7 million shares of stock.
- our people – a team of talented professionals focused on listening and responding to Customers;
•a high-quality asset base, with leading market shares in many of the nation’s largest and fastest growing- a high-quality asset base with leading market shares in many of the nation’s largest and fastest-growing markets;
•broad geographic diversity and multiple retail formats that allow Kroger to meet the needs of virtually every Customer; - broad geographic diversity and multiple retail formats that allow Kroger to meet the needs of our diverse Customers;
- our Customer loyalty card database, plus a unique data analysis capability;
- outstanding private-label products that have earned industry-leading market share; and
- a successful track record of competing head-to-head against supercenters.
TRONGM
Kroger also operates 779 convenience stores, currently operate in Phoenix, Arizona; Salt Lake City, Utah; and Columbus, Ohio. Kroger Marketplace will enter the Cincinnati market in 2006 with two stores. We are excited about our Marketplace412 fine jewelry stores and how they enable us to meet our Customers’ needs.
2
CUSTOMER INSIGHT
Over the past several years, Kroger has oneaccumulated a substantial database that provides valuable insight into the shopping behaviors of the most robust retail customer databases in America.our Customers through our store loyalty card programs. More than 20 million households actively use one of our store loyalty cards. The data from these cards provides us with valuable insights into our Customers’ shopping behaviors.
EADING C
Today, more than 10,000 corporate brand products are available only in Kroger’s family of stores. Our private label grocery items, in terms of dollars, represent approximately 24% of the Company’s grocery sales.
Most of our high-quality, private-label products are made in one of our 42 manufacturing plants.
We continue to face competitive challenges on a budget. Our banner brands, either Kroger or the name of the retail store, offer excellent quality and value and come with a guarantee that consumers can “try it, like it, or get the national brand free.” Private Selection is Kroger’s premium brand, offering the finest quality—again at attractive prices.
As in 2006, strong identical sales, slightly improving operating margins, and fewer shares outstanding will drive Kroger’s earnings per share growth this year.
Kroger’s quarterly cash dividend is an important component of shareholder return. We expect the combination of the Company’s dividend and earnings per share target of $1.60 to exceed their expectations better than anyone else. These are difficult challenges, but we are confident$1.65 to deliver a double-digit return for Kroger people are up to the task.
As in the past, these labor negotiations will be challenging in the face of competitive pressures and rising pension and health care costs. We will continue to seek balanced agreements that provide good wages and benefits at a cost that is fair to all.
43
Last year, our family of the A2H network. Kroger is a major contributor to the national fight to end hunger. In 2005, we supported food banks with donations of time, expertise, funds andstores contributed more than 2930 million pounds of food and groceryother products valued at $43.7 million.
| Jim Herzberg, Atlanta Division | |
| Betty Porter, Central Division | |
| Keith Eve, Cincinnati/Dayton Division | |
| Kevin Flohr, City Market | |
| Gary L. Moore, Delta Division | |
| Mariana Barrenechea, Dillon Stores | |
| Marnie L. Green, Food 4 Less | |
| Cindi Corderman, Fred Meyer | |
| Randy Poston, Fry’s | |
| Dave Fannin, Great Lakes Division | |
| Mark Combs, Jay C Stores | |
| Matt LeClaire, King Soopers | |
| Ed Southern, Mid-Atlantic | |
| Dorian Shields, Mid-South | |
| Sue Brooks, QFC | |
| Debbie Muhler, Ralphs | |
| Emily Brito, Smith’s | |
| Jim Dickinson, Southwest Division | |
| Veronica Johnson, Country Oven Bakery | |
| Lisa Webb, Pace Dairy | |
| Lewis and Maria Tracy, Layton Dairy | |
| Art Anderson, Delight Products | |
| Anne Sturgis, General Office |
ENVIRONMENTAL STEWARDSHIP
4
We have learned that one of travel distribution services for Cendant Corporation, Senior Vice President for technology at eBay Inc.,the most effective ways to reduce energy consumption is by establishing best practices, which we do with the help of every Associate in every store. Our local energy teams create and Senior Vice Presidentimplement store-specific energy reduction plans. We also have programs in place to train and CIO for Federal Express Corporation. Technology is a critical factor in Kroger’s ability to serve our Customers, partner with our suppliers, and empowereducate all of our Associates and we are pleased to have Mr. Hjelm leading ourabout good energy habits.
Our ongoing efforts in this area.
Diversity is one of Kroger’s core values and to underscore its importance, Kroger named Carver Johnson as the Company’s first Chief Diversity Officer last year. Mr. Johnson, who has been with Kroger since 1999, and his team focus on hiring, training and retaining a diverse work force and oversee Kroger’s supplier diversity efforts. Kroger has been a leader in the use of minority and women-owned business enterprises (M/WBE) in all aspects of our business for more than 25 years, spending $1 billion annually with M/WBEs.
Several individuals were named to lead retail divisions this year, continuing Kroger’s strong track record of developing leaders and creating opportunities for them within the Company.
Robert Moeder was named President of Kroger’s Central Division, bringing more than 30 years of retail and division management experience in Kroger to his new position. Mark Prestidge was promoted to President of Kroger’s Delta Division, after holding several leadership positions in the supermarket industry.Michael Ellis was named President of the Company’s Fred Meyer division after serving in several leadership positions within Kroger.
On behalf of our entire Company, we extend our appreciation and congratulations to John Burgon, Senior Vice President,Richard Tillman, who retired after 33 years in the grocery business. Mr. Burgon began hisa 42-year career with King SoopersKroger. Mr. Tillman joined Kroger as a producepart-time food store clerk and held a variety of upper-level management positions within several Kroger divisions,with increasing responsibility throughout his career, including presidentPresident of RalphsKroger’s Delta division.
DELIVERING IMPROVED SERVICE, SELECTIONAND VALUE
Kroger’s Customer 1st strategic plan served Customers, Associates and president of King Soopers.
We must continue to listen closely to our Customers—to truly hear what they say about usCustomers and how well we are meetingput their expectations. We must embrace change. And above all, we must put our Customers first—expectations and needs first – in every store, inarea of our business, every decision, every day.


David B. Dillon
Chairman of the Board and
Chief Executive Officer
of The Kroger Co.:
| 1. | To elect |
| 2. | To consider, act upon and approve | ||
| 3. | To consider, act upon and approve a proposal on rules of conduct for shareholder meetings and meetings outside of Cincinnati; | ||
| 4. | To consider and act upon a proposal to ratify the selection of independent auditors for the year | ||
| 5. | To act upon | ||
| 6. | To transact such other business as may properly be brought before the meeting; | ||
| By order of the Board of Directors, | |
| Paul W. Heldman, Secretary |
Item No. 3, below is adopted. The affirmative vote representing at least 75% of the outstanding shares of our common stock is required to amend Kroger’s Regulations to provide for annual election of all directors. Abstentions and broker non-votes will have the same effect as votes against this proposal.
97
(ITEM NO. 1)
| Professional | Director | ||||
| Name | Occupation (1) | Age | Since | ||
| NOMINEES FORDIRECTOR FOR TERMS OFOFFICE | |||||
| CONTINUINGUNTIL2008 | |||||
| Reuben V. Anderson | Mr. Anderson is a member in the Jackson, Mississippi, office of Phelps Dunbar, a regional law firm based in New Orleans. Prior to joining this law firm, he was a justice of the Supreme Court of Mississippi. Mr. Anderson is a director of Trustmark National Bank and AT&T Inc. He is a member of the Corporate Governance and Public Responsibilities Committees. | 64 | 1991 | ||
| John L. Clendenin | Mr. Clendenin is Chairman Emeritus of BellSouth Corporation, a holding company with subsidiaries in the telecommunications business. From January 1984 through December 1996 he was its Chairman of the Board and Chief Executive Officer. Mr. Clendenin is a director of Equifax Incorporated, The Home Depot, Inc., Powerwave Technologies, Inc., and Acuity Brands, Inc. He is a member of the Compensation and Corporate Governance Committees. | 72 | 1986 | ||
8
Reuben V. Anderson | Mr. Anderson is a member in the Jackson, Mississippi, office of Phelps Dunbar, a regional law firm based in New Orleans. Prior to joining this law firm, he was a justice of the Supreme Court of Mississippi. Mr. Anderson is a director of Trustmark National Bank and BellSouth Corporation. He is a member of the Audit and Public Responsibilities Committees. | 63 | 1991 | |||||||||||
Don W. McGeorge | Mr. McGeorge was elected President and Chief Operating Officer of Kroger in 2003. Before that he was elected Executive Vice President in 2000 and Senior Vice President in 1997. | 51 | 2003 | |||||||||||
W. Rodney McMullen | Mr. McMullen was elected Vice Chairman of Kroger in 2003. Before that he was elected Executive Vice President in 1999 and Senior Vice President in 1997. Mr. McMullen is a director of Cincinnati Financial Corporation. | 45 | 2003 | |||||||||||
Clyde R. Moore | Mr. Moore is the Chairman and Chief Executive Officer of First Service Networks, a national provider of facility and maintenance repair services. He is a director of First Service Networks. Mr. Moore is a member of the Audit and Public Responsibilities Committees. | 52 | 1997 | |||||||||||
| Professional | Director | ||||
| Name | Occupation (1) | Age | Since | ||
| David B. Dillon | Mr. Dillon was elected Chairman of the Board of Kroger in 2004, Chief Executive Officer in 2003, and President and Chief Operating Officer in 2000. He served as President in 1999, and as President and Chief Operating Officer from 1995-1999. Mr. Dillon was elected Executive Vice President of Kroger in 1990 and President of Dillon Companies, Inc. in 1986. He is a director of Convergys Corporation. | 56 | 1995 | ||
| David B. Lewis | Mr. Lewis is Chairman, President and Chief Executive Officer of Lewis & Munday, a Detroit based law firm with offices in Washington, D.C. and Seattle. He is a director of H&R Block. Mr. Lewis has served on the Board of Directors of Conrail, Inc., LG&E Energy Corp., Lewis & Thompson Agency, Inc., M.A. Hanna, TRW, Inc. and Comerica, Inc. He is chair of the Audit Committee and vice chair of the Public Responsibilities Committee. | 62 | 2002 | ||
| Don W. McGeorge | Mr. McGeorge was elected President and Chief Operating Officer of Kroger in 2003. Before that he was elected Executive Vice President in 2000 and Senior Vice President in 1997. | 52 | 2003 | ||
| W. Rodney McMullen | Mr. McMullen was elected Vice Chairman of Kroger in 2003. Before that he was elected Executive Vice President in 1999 and Senior Vice President in 1997. Mr. McMullen is a director of Cincinnati Financial Corporation. | 46 | 2003 | ||
| Jorge P. Montoya | Mr. Montoya was the President of The Procter& Gamble Company’s Global Snacks & Beverage division, and President of Procter & Gamble Latin America, from 1999 until his retirement in 2004.Prior to that, he was an Executive Vice President of Procter & Gamble from 1995 to 1999. Mr. Montoya is a director of Gap, Inc. and Rohm & Haas Company.He is a member of the Compensation and Public Responsibilities Committees. | 60 | 2007 | ||
| Clyde R. Moore | Mr. Moore is the Chairman and Chief Executive Officer of First Service Networks, a national provider of facility and maintenance repair services. He is a director of First Service Networks. Mr. Moore is a member of the Audit and Compensation Committees. | 53 | 1997 | ||
9
Robert D. Beyer | Mr. Beyer is Chief Executive Officer of The TCW Group, Inc., an investment management firm, where he has been employed since 1995. From 1991 to 1995, he was the co-Chief Executive Officer of Crescent Capital Corporation, which was acquired by TCW in 1995. Mr. Beyer is also a member of the Board of Directors of TCW and its ultimate parent, Société Générale Asset Management, S.A. He is chair of the Financial Policy Committee and a member of the Compensation Committee. | 46 | 1999 | |||||||||||
John T. LaMacchia | Mr. LaMacchia is Chairman of the Board of Tellme Networks, Inc., a provider of voice application networks. From September 2001 through December 2004 he was also Chief Executive Officer of Tellme Networks. From October 1993 through February 1999, Mr. LaMacchia was President and Chief Executive Officer of Cincinnati Bell Inc. From May 1999 to May 2000 he was Chief Executive Officer of CellNet Data Systems, Inc., a provider of wireless data communications. Mr. LaMacchia is a director of Tellme Networks, Inc. He is chair of the Compensation Committee and a member of the Corporate Governance Committee. | 64 | 1990 | |||||||||||
Katherine D. Ortega | Ms. Ortega served as an Alternate Representative of the United States to the 45th General Assembly of the United Nations in 1990-1991. Prior to that, she served as Treasurer of the United States. Ms. Ortega is a director of Rayonier Inc., Washington Mutual Investors Fund and JPMorgan Value Opportunities Fund, and Trustee of the American Funds Tax Exempt Series I. She is chair of the Public Responsibilities Committee and a member of the Corporate Governance Committee. | 71 | 1992 | |||||||||||
| Professional | Director | ||||
| Name | Occupation (1) | Age | Since | ||
| Susan M. Phillips | Dr. Phillips is Dean and Professor of Finance at The George Washington University School of Business, a position she has held since 1998. She was a member of the Board of Governors of the Federal Reserve System from December 1991 though June 1998. Before her Federal Reserve appointment, Dr. Phillips served as Vice President for Finance and University Services and Professor of Finance in The College of Business Administration at the University of Iowa from 1987 through 1991. She is a director of State Farm Mutual Automobile Insurance Company, State Farm Life Insurance Company, State Farm Companies Foundation, National Futures Association, the Chicago Board Options Exchange and the Chicago Futures Exchange. Dr. Phillips also is a trustee of the Financial Accounting Foundation. She is a member of the Audit and Financial Policy Committees. | 62 | 2003 | ||
| Steven R. Rogel | Mr. Rogel was elected Chairman of the Board of Weyerhaeuser Company in 1999 and has been President and Chief Executive Officer and a director thereof since December 1997. Before that time he was Chief Executive Officer, President and a director of Willamette Industries, Inc. Mr. Rogel served as Chief Operating Officer of Willamette Industries, Inc. until October 1995 and, before that time, as an executive and group vice president for more than five years. He is a director of Union Pacific Corporation. Mr. Rogel has been appointed by the Board to serve as Lead Director. He is chair of the Corporate GovernanceCommittee and a member of the Financial Policy Committee. | 64 | 1999 | ||
| James A. Runde | Mr. Runde is a special advisor and a former Vice Chairman of Morgan Stanley, where he has been employed since 1974. He was a member of the Board of Directors of Burlington Resources Inc. prior to its acquisition by ConocoPhillips in 2006. Mr. Runde serves as a trustee of Marquette University and the Pierpont Morgan Library. He is a member of the Compensation and Financial Policy Committees. | 60 | 2006 | ||
10
John L. Clendenin | Mr. Clendenin is Chairman Emeritus of BellSouth Corporation, a holding company with subsidiaries in the telecommunications business. From January 1984 through December 1996 he was its Chairman of the Board and Chief Executive Officer. Mr. Clendenin is a director of Equifax Incorporated, The Home Depot, Inc., Powerwave Technologies, Inc., and Acuity Brands, Inc. He is a member of the Compensation and Corporate Governance Committees. | 71 | 1986 | |||||||||||
David B. Dillon | Mr. Dillon was elected Chairman of the Board of Kroger in 2004, Chief Executive Officer in 2003, and President and Chief Operating Officer in 2000. He served as President in 1999, and as President and Chief Operating Officer from 1995-1999. Mr. Dillon was elected Executive Vice President of Kroger in 1990 and President of Dillon Companies, Inc. in 1986. He is a director of Convergys Corporation. | 55 | 1995 | |||||||||||
David B. Lewis | Mr. Lewis is Chairman, President and Chief Executive Officer of Lewis & Munday, a Detroit based law firm with offices in Washington, D.C. and Seattle. He is a director of H&R Block and Lewis & Thompson Agency, Inc. Mr. Lewis has served on the Board of Directors of Conrail, Inc., LG&E Energy Corp., M.A. Hanna, TRW, Inc. and Comerica, Inc. He is chair of the Audit Committee and vice chair of the Public Responsibilities Committee. | 61 | 2002 | |||||||||||
| Professional | Director | ||||
| Name | Occupation (1) | Age | Since | ||
| Ronald L. Sargent | Mr. Sargent is Chairman and Chief Executive Officer of Staples, Inc., where he has been employed since 1989. Prior to joining Staples, Mr. Sargent spent 10 years with Kroger in various positions. In addition to serving as a director of Staples, Mr. Sargent is a director of Mattel, Inc. He is a member of the Audit and Public Responsibilities Committees. | 51 | 2006 | ||
| DIRECTORSWHOSETERMSOFOFFICECONTINUEUNTIL 2008 | |||||
| Robert D. Beyer | Mr. Beyer is Chief Executive Officer of The TCW Group, Inc., an investment management firm, where he has been employed since 1995. From 1991 to 1995, he was the co-Chief Executive Officer of Crescent Capital Corporation, which was acquired by TCW in 1995. Mr. Beyer is a member of the Board of Directors of TCW and its parent, Société Générale Asset Management, S.A. He is also a member of the Board of Directors of The Allstate Corporation. Mr. Beyer is chair of the Financial Policy Committee and a member of the Compensation Committee. | 47 | 1999 | ||
| John T. LaMacchia | Mr. LaMacchia is Chairman of the Board of Tellme Networks, Inc., a provider of voice application networks. From September 2001 through December 2004 he was also Chief Executive Officer of Tellme Networks. From October 1993 through February1999, Mr. LaMacchia was President and Chief Executive Officer of Cincinnati Bell Inc. From May 1999 to May 2000 he was Chief Executive Officer of CellNet Data Systems, Inc., a provider of wireless data communications. He is chair of the Compensation Committee and a member of the Corporate Governance Committee. | 65 | 1990 | ||
| Katherine D. Ortega | Ms. Ortega served as an Alternate Representative of the United States to the 45th General Assembly of the United Nations in 1990-1991. Prior to that, she served as Treasurer of the United States. Ms. Ortega is a director of Rayonier Inc., Washington Mutual Investors Fund and JPMorgan Value Opportunities Fund, and Trustee of the American Funds Tax Exempt Series I. She is chair of the Public Responsibilities Committee and a member of the Financial Policy Committee. | 72 | 1992 | ||
11
| Professional | Director | ||||
| Name | Occupation (1) | Age | Since | ||
| Bobby S. Shackouls | Until the merger of Burlington Resources Inc. and ConocoPhillips, which became effective on March 31, 2006, Mr. Shackouls was Chairman of the Board of Burlington Resources Inc., a natural resources business, since July 1997 and its President and Chief Executive Officer since December 1995. He had been a director of that company since 1995 and President and Chief Executive Officer of Burlington Resources Oil and Gas Company (formerly known as Meridian Oil Inc.), a wholly-owned subsidiary of Burlington Resources, since 1994. Mr. Shackouls is a director of ConocoPhillips. He is vice chair of the Audit and Corporate Governance Committees. | 56 | 1999 | ||
| (1) | Except as noted, each of the directors has been employed by his or her present employer (or a subsidiary) in an executive capacity for at least five years. |
12
|
13
The Board elected Mr. Montoya, Mr. Runde and Mr. Sargent as directors to fill vacancies since the 2006 annual meeting. Non-management directors, our CEO, and a third-party search firm jointly recommended each of these directors.
CORPORATE GOVERNANCE
The Board of Directors has adoptedGuidelines on Issuesof Corporate Governance. TheseGuidelines, which include copies of the current charters for the Audit, Compensation and Corporate Governance Committees, and the other committees of the Board of Directors, are available on our corporate website at www.kroger.com.www.thekrogerco.com Shareholders may obtain a copy of theGuidelines by making a written request to Kroger’s Secretary at our executive offices.
NDEPENDENCE
14
CSHAREHOLDER COMMUNICATIONSWITHTHE BOARD
Governance Committee for further consideration. The chair of the Corporate Governance Committee will take such action as he or she deems appropriate, which may include referral to the Corporate Governance Committee or the entire Board.
| COMPENSATION DISCUSSIONAND ANALYSIS |
| SUMMARY COMPENSATION TABLE | ||||||||||||||||||||||||||||
|---|---|---|---|---|---|---|---|---|---|---|---|---|---|---|---|---|---|---|---|---|---|---|---|---|---|---|---|---|
| Annual Compensation | Long-Term Compensation | |||||||||||||||||||||||||||
| Awards | Payouts | |||||||||||||||||||||||||||
| Name and Principal Position | Year | | Salary ($) | | Bonus ($) | | Other Annual Compensation ($) | | Restricted Stock Awards ($) | | Securities Underlying Options/ SARs (#) | | LTIP Payouts ($) | | All Other Compensation ($) | |||||||||||||
| (1) | (2) | (3) | (4) | (5) | ||||||||||||||||||||||||
| David B. Dillon | 2005 | $ | 1,100,000 | $ | 1,940,131 | $ | 43,355 | $ | 0 | 300,000 | $ | 0 | $ | 62,407 | ||||||||||||||
| Chairman and Chief | 2004 | $ | 1,083,974 | $ | 736,361 | $ | 33,900 | $ | 0 | 300,000 | $ | 0 | $ | 52,256 | ||||||||||||||
| Executive Officer | 2003 | $ | 880,062 | $ | 244,962 | $ | 21,622 | $ | 2,517,000 | 0 | $ | 0 | $ | 28,575 | ||||||||||||||
| W. Rodney McMullen | 2005 | $ | 773,000 | $ | 1,221,870 | $ | 13,368 | $ | 0 | 75,000 | $ | 0 | $ | 20,186 | ||||||||||||||
| Vice Chairman | 2004 | $ | 772,647 | $ | 468,979 | $ | 10,469 | $ | 0 | 75,000 | $ | 0 | $ | 18,341 | ||||||||||||||
| 2003 | $ | 704,077 | $ | 181,865 | $ | 8,614 | $ | 1,678,000 | 0 | $ | 0 | $ | 14,333 | |||||||||||||||
| Don W. McGeorge | 2005 | $ | 773,000 | $ | 1,221,870 | $ | 29,903 | $ | 0 | 75,000 | $ | 0 | $ | 40,088 | ||||||||||||||
| President and Chief | 2004 | $ | 772,647 | $ | 468,979 | $ | 24,834 | $ | 0 | 75,000 | $ | 0 | $ | 35,155 | ||||||||||||||
| Operating Officer | 2003 | $ | 681,462 | $ | 176,298 | $ | 16,480 | $ | 1,678,000 | 0 | $ | 0 | $ | 23,509 | ||||||||||||||
| Paul W. Heldman | 2005 | $ | 618,000 | $ | 710,005 | $ | 20,829 | $ | 0 | 40,000 | $ | 0 | $ | 32,706 | ||||||||||||||
| Senior Vice President, | 2004 | $ | 617,808 | $ | 275,870 | $ | 19,577 | $ | 0 | 40,000 | $ | 0 | $ | 27,698 | ||||||||||||||
| Secretary and General | 2003 | $ | 567,739 | $ | 116,913 | $ | 14,934 | $ | 671,200 | 0 | $ | 0 | $ | 21,007 | ||||||||||||||
| Counsel | ||||||||||||||||||||||||||||
| Donald E. Becker | 2005 | $ | 536,250 | $ | 685,238 | $ | 24,780 | $ | 969,000 | 40,000 | $ | 0 | $ | 37,630 | ||||||||||||||
| Executive Vice President | 2004 | $ | 487,981 | $ | 242,978 | $ | 16,746 | $ | 156,500 | 40,000 | $ | 0 | $ | 25,503 | ||||||||||||||
| 2003 | $ | 438,462 | $ | 95,108 | $ | 14,214 | $ | 0 | 0 | $ | 0 | $ | 22,416 | |||||||||||||||
| Michael S. Heschel | 2005 | $ | 596,022 | $ | 772,750 | $ | 43,055 | $ | 0 | 45,000 | $ | 0 | $ | 71,072 | ||||||||||||||
| Former Executive Vice | 2004 | $ | 599,692 | $ | 297,940 | $ | 55,401 | $ | 0 | 45,000 | $ | 0 | $ | 84,310 | ||||||||||||||
| President and Chief | 2003 | $ | 578,077 | $ | 130,275 | $ | 44,244 | $ | 419,500 | 0 | $ | 0 | $ | 68,183 | ||||||||||||||
| Information Officer | ||||||||||||||||||||||||||||
- Make total compensation competitive;
- Include opportunities for equity ownership as part of compensation; and
our subsidiaries. - Use incentive compensation to help drive performance by providing superior pay for superior results.
The following table shows option grants in fiscal year 2005 todiscussion and analysis addresses the named executive officers:
| OPTION/SAR GRANTS IN LAST FISCAL YEAR | |||||||||||||||||||||||||||||||
|---|---|---|---|---|---|---|---|---|---|---|---|---|---|---|---|---|---|---|---|---|---|---|---|---|---|---|---|---|---|---|---|
| Individual Grants | Potential Realizable Value at Assumed Annual Rates of Stock Price Appreciation for Option Term | ||||||||||||||||||||||||||||||
| Name | | Number of Securities Underlying Options/SAR Granted | | % of Total Options/SARs Granted to Employees in Fiscal Year | | Exercise or Base Price ($/Share) | | Expiration Date | | 0% | | 5% | | 10% | |||||||||||||||||
| David B. Dillon | 300,000 | 4.41 | % | $ | 16.39 | 5/5/2015 | $ | 0 | $ | 3,091,332 | $ | 7,834,041 | |||||||||||||||||||
| W. Rodney McMullen | 75,000 | 1.10 | % | $ | 16.39 | 5/5/2015 | $ | 0 | $ | 772,833 | $ | 1,958,510 | |||||||||||||||||||
| Don McGeorge | 75,000 | 1.10 | % | $ | 16.39 | 5/5/2015 | $ | 0 | $ | 772,833 | $ | 1,958,510 | |||||||||||||||||||
| Paul W. Heldman | 40,000 | 0.59 | % | $ | 16.39 | 5/5/2015 | $ | 0 | $ | 412,178 | $ | 1,044,539 | |||||||||||||||||||
| Donald E. Becker | 40,000 | 0.59 | % | $ | 16.39 | 5/5/2015 | $ | 0 | $ | 412,178 | $ | 1,044,539 | |||||||||||||||||||
| Michael S. Heschel | 45,000 | 0.66 | % | $ | 16.39 | 5/5/2015 | $ | 0 | $ | 463,700 | $ | 1,175,106 | |||||||||||||||||||
EXECUTIVE COMPENSATION – OBJECTIVES
The Committee has several related objectives regarding compensation. First, the Committee believes that compensation must be designed to attract and retain those best suited to fulfill the challenging roles that executive officers play at Kroger. Second, some elements of compensation should help align the interests of the officers with your interests as shareholders. Third, compensation should create strong incentives for the officers (a) to achieve the annual business plan targets established by the Board, and (b) to assure that the officers work within the framework of Kroger’s long-term strategic objectives. In developing compensation programs and amounts to meet these objectives, the Committee exercises restraint to assure that executive officer compensation does not exceed reasonable and competitive levels in light of Kroger’s performance and the needs of the business.
To meet these objectives, the Committee has taken a number of steps over the last several years, including the following:
- Conducted an annual review of all components of executive officer compensation, quantifying total compensation on tally sheets. The review includes an assessment for each officer, including the CEO, of salary; performance-based cash compensation, or bonus; equity and long-term incentive compensation; accumulated realized and unrealized stock option gains and restricted stock values; the value of
unexercised options:
| AGGREGATED OPTION/SAR EXERCISES IN LAST FISCAL YEAR AND FY-END OPTION/SAR VALUES TABLE | |||||||||||||||||||
|---|---|---|---|---|---|---|---|---|---|---|---|---|---|---|---|---|---|---|---|
| Name | | Shares Acquired on Exercise (#) | | Value Realized ($) | | Number of Securities Underlying Unexercised Options/SARs at F/Y End (1) (#) Exercisable/ Unexercisable | | Value of Unexercised In-the-Money Options/SARs at F/Y End (1) ($) Exercisable/ Unexercisable | |||||||||||
| David B. Dillon | 172,000 | $ | 1,669,930 | 576,000/849,000 | $ | 1,188,580/$1,333,247 | |||||||||||||
| W. Rodney McMullen | 40,000 | $ | 388,900 | 450,000/355,000 | $ | 1,342,238/$507,580 | |||||||||||||
| Don McGeorge | 48,000 | $ | 493,440 | 422,500/347,500 | $ | 1,802,385/$507,580 | |||||||||||||
| Paul W. Heldman | 50,000 | $ | 477,250 | 322,499/208,001 | $ | 1,050,392/$283,884 | |||||||||||||
| Donald E. Becker | 16,000 | $ | 152,720 | 276,999/194,001 | $ | 938,340/$274,003 | |||||||||||||
| Michael S. Heschel | 0 | $ | 0 | 534,000/45,000 | $ | 1,108,766/$98,325 | |||||||||||||
16
- Recommended share ownership guidelines, adopted by the
New York Stock Exchange.Board of Directors. These guidelines require directors, officers and some other key executives to acquire and hold a minimum dollar value of Kroger stock. TheCommittee is responsibleguidelines require the CEO to acquire and maintain ownership of Kroger shares equal to 5 times his base salary; the Vice Chairman and the Chief Operating Officer to acquire and maintain ownership at 4 times their base salaries; Executive Vice Presidents, Senior Vice Presidents and non-employee directors at 3 times their base salaries or annual cash retainers; and other officers and key executives at 2 times their base salaries.
ESTABLISHING EXECUTIVE COMPENSATION
The independent members of the Board have the exclusive authority to determine the amount of the CEO’s salary; the bonus level for the approvalCEO; the nature and administrationamount of any equity awards made to the base salaryCEO; and any other compensation questions related to the CEO. In setting the “bonus level” for the CEO, the independent directors determine the dollar amount that will be multiplied by the percentage payout under the annual bonus plan applicable to all corporate management. The independent directors retain discretion to reduce the percentage payout the CEO would otherwise receive. The independent directors thus make a separate determination annually concerning both the CEO’s bonus level and bonus compensation programs, as well as the equity incentive program forpercentage of bonus paid.
The Committee performs the same function and exercises the same authority as to the other named executive officers.
- A detailed report, by officer, that
generally aredescribes current compensation, the value of equity compensation previously awarded, the value of retirement benefits earned, and any severance or other benefits payable upon a change of control. - An internal equity comparison of compensation at
or abovevarious senior levels. This current and historical analysis is undertaken to assure that themedian compensation paid by competitors for comparable positions (where data for comparable positions are available) with an annual bonus potential that, if the annual bonus plan goals are realized, would cause their total cashrelationship of CEO compensation tobe above the median,other senior officer compensation, and senior officer compensation to other levels in thethird quartile.
In considering each of the factors above, the Committee does not make use of a formula, but rather subjectively reviews each in making its compensation determination.
17
THE COMMITTEE’S COMPENSATION CONSULTANTAND BENCHMARKING
The Committee directly engages a compensation consultant from Mercer Human Resource Consulting anto advise the Committee in the design of compensation for executive compensation consulting firm, to perform competitive peer analysisofficers. While the parent and to determine whether the compensationaffiliated companies of the executive officers actually met our compensation philosophy. In conjunction with Kroger, Mercer Human Resource Consulting identified a group of peer retail companies, based primarily on similarity of lines of business, against which officer compensation is measured. Mercer Human Resource Consulting concludedperform other services for us, the Committee has found that the total compensation of the executive officers was at or near the median of the peer companies. The Committee has concluded that the compensation consultant is independent in part because (a) he was first engaged by the Committee before he became associated with Mercer; (b) he works exclusively for the Committee and not for managementour management; and (c) he does not benefit from the other work that Mercer performs for Kroger.
The consultant conducts an annual competitive assessment of Kroger.executive positions at Kroger for the Committee. The assessment is one of several bases, as described above, on which the Committee determines compensation. The consultant assesses base salary; target annual performance-based bonus; target cash compensation (the sum of salary and bonus); annualized long-term incentive awards, such as stock options, other equity awards, and performance-based long-term bonuses; and total direct compensation (the sum of all these elements). The consultant compares these elements against those of other companies in a peer group of publicly-traded food and drug retailers. For 2006, the group consisted of:
| Albertson’s | Safeway | |
| Costco Wholesale | Supervalu | |
| CVS | Target | |
| Great Atlantic & Pacific Tea | Walgreens | |
| Rite Aid | Wal-Mart |
The make-up of the compensation peer group is reviewed annually and modified as circumstances warrant. Industry consolidation and other competitive forces will change the peer group used. The consultant also provides the Committee data from companies in “general industry,” a representation of major publicly-traded companies. These data are a reference point, particularly for senior staff positions where competition for talent extends beyond the retail sector.
Based in part on the analysis performed by the Committee’s compensation consultant, the Committee concluded in 2005 that when comparing total compensation of the named executive officers to that of the peer group:
- cash compensation for the named executive officers as a group fell approximately at the median, and
- long-term compensation for the named executive officers fell substantially below the median.
As a result, the Committee determined to increase the potential for the named executive officers to earn long-term compensation through the adoption of a performance-based long-term bonus plan. The long-term bonus plan is discussed in more detail below.
18
COMPONENTSOF EXECUTIVE COMPENSATIONAT KROGER
Compensation for our named executive officers is comprised of the following:
- Salary
- Performance-Based Annual Cash Bonus (annual, non-equity incentive pay)
- Performance-Based Long-Term Cash Bonus (long-term, non-equity incentive pay)
- Equity
- Retirement and other benefits
- Perquisites
SALARY
We provide our named executive officers and other employees a fixed amount of cash compensation—salary—for the executive’s work. Salaries for named executive officers are established each year by the Committee. Salaries for the named executive officers typically are reviewed in May of each year.
The amount of each executive’s salary is influenced by numerous factors including:
- An assessment of individual contribution in the judgment of the CEO and the Committee (or, in thecase of the CEO, of the Committee)
- Benchmarking with comparable positions at peer group companies
- Tenure with Kroger
- Relationship with the salaries of other executives at Kroger.
In 2006, the named executive officers by evaluating both the most recent comparative peer data available and each officer’s role and responsibilities. The Committee reviews individual salaries on an annual basis and basesreceived salary increases on Kroger’s overall performance as well asfollowing the executive’s performance, roleannual review of their compensation in May.
| Salaries | |||||
| 2005 | 2006 | ||||
| David B. Dillon | $ | 1,100,000 | $ | 1,150,000 | |
| J. Michael Schlotman | $ | 450,000 | $ | 505,000 | |
| W. Rodney McMullen | $ | 773,000 | $ | 805,000 | |
| Don W. McGeorge | $ | 773,000 | $ | 805,000 | |
| Donald E. Becker | $ | 540,000 | $ | 575,000 | |
The increases for Mr. Becker and contribution.
19
The Committee considers several factors in making its determination or recommendation as to bonus potentials. First, the Committee’s February 27, 2006 meeting,individual’s level within the Committee discussed bonus payments to the executive officers and considered performance as compared to the goalsorganization is a factor in that the Committee believes that more senior executives should have a greater part of their compensation dependant upon Kroger’s performance. Second, the individual’s salary is a factor so that a substantial portion of a named executive officer’s total cash compensation is dependant upon Kroger’s performance. Finally, the Committee considers the report of its compensation consultant to assess the bonus potential of the named executive officers in light of total compensation paid to comparable executive positions in the industry.
The bonus potential of each named executive officer for 2005 and 2006 is shown below. Mr. Becker’s bonus potential was increased because of an increase in salary and responsibility.
| Bonus | |||||
| 2005 | 2006 | ||||
| David B. Dillon | $ | 1,500,000 | $ | 1,500,000 | |
| J. Michael Schlotman | $ | 450,000 | $ | 450,000 | |
| W. Rodney McMullen | $ | 950,000 | $ | 950,000 | |
| Don W. McGeorge | $ | 950,000 | $ | 950,000 | |
| Donald E. Becker | $ | 525,000 | $ | 550,000 | |
The amount of bonus that the named executive officers earn each year is determined by Kroger’s performance compared to targets established by the Committee based on the business plan adopted by the Board of Directors. In 2006, thirty percent of bonus was earned based on an identical sales target; thirty percent was based on a target for EBITDA; thirty percent was based on a set of measures for implementation and results under our strategic plan; and ten percent was based on the 2005 plan year. Based on performance of new capital projects compared to their budgets. Targets in all cases allow for minimal bonus to be earned at relatively low levels to provide incentive for achieving even higher levels of performance. The extent to which Kroger fell short of, met, or exceeded the targets established in each of these areas at the beginning of 2006 determined the percentage of each named executive officer’s bonus potential paid for 2006.
In 2006, as in all years, the Committee retained discretion to reduce the bonus payout for named executives officers if the Committee determined for any reason that Kroger (i) had exceeded its EBITDA objective, (ii) had exceeded itsthe bonus payouts were not appropriate.The independent directors retained that discretion for the CEO’s bonus. Those bodies also retained discretion to adjust the targets under the plan should unanticipated developments arise during the year.
Following the close of the year, the Committee reviewed Kroger’s performance against the identical sales, objective, (iii) had substantially achieved its objective for execution of theEBITDA, strategic plan and (iv) had exceededcapital projects objectives. The Committee made one adjustment that reduced the minimum sales and EBIDTA thresholds established for its capital projects. As a result,bonuses of the Committee determined that thenamed executive officers had earned 132.094% of their bonus potentials, which was slightlyby less than the 133.522% applicable to all other eligible employees participating in the corporate bonus plan.one percent. The Committee determined that income from the officers weresale of certain assets should not eligible to receive certain adjustments that causedbe included in EBITDA for purposes of the bonus payoutcalculation. The independent members of the Board made the same adjustment, resulting in the same reduction of bonus, for the CEO. No other eligible participants to be higher.adjustments were made. As a result, each of the named executive officers earned 141.118% of their bonus potentials.
20
The percentage paid for 2006 represented and resulted from an extraordinary performance against the business plan objectives. A comparison of bonus percentages for the named executive officers in prior years demonstrates the variability of incentive compensation:
| Fiscal Year | Bonus Percentage | ||||
| 2006 | 141.118 | % | |||
| 2005 | 132.094 | % | |||
| 2004 | 55.174 | % | |||
| 2003 | 24.1 | % | |||
| 2002 | 9.9 | % | |||
The actual payout percentages reflectamounts of annual performance-based cash bonuses paid to the extent to which Kroger achievednamed executive officers for 2006 are shown in the 2005Summary Compensation table under the heading “Non-Equity Incentive Plan Compensation.” These amounts represent the bonus objectives establishedpotentials for each named executive officer multiplied by the Committee.
- improving its performance in four key categories, based on results of customer
surveys,surveys; and(ii) - reducing total operating costs as a percentage of sales, excluding fuel.
- The compensation consultant’s benchmarking report regarding equity-based and other long-term compensation awarded by our competitors;
- The officer’s level in the organization and the internal
equity is an important factor to be considered in establishing compensation for the officers. While the Committee has not established a policy regarding the ratiorelationship oftotal compensationequity-based awards within Kroger; - Individual performance; and
- The recommendation of the
Chief Executive Officer to thatCEO, for all named executive officers other than in the case of theother officers, it does review compensation levels to ensure that appropriate equity exists. The Committee intends to continue to review internal compensation equity and may adopt a formal policy if it deems such adoption would be appropriate.
Amounts of equity awards issued and outstanding for the Board regarding the Chief Executive Officer’s compensation, the aggregate amounts and mix of all of the components, including accumulated (realized and unrealized) option and restricted stock gains,named executive officers are taken into considerationset forth in the Committee’s decisions.
Kroger maintains a defined benefit and several defined contribution retirement plans for its employees.The Committee and the Board of Directors believe that the caliber and motivation of all of our employees, including our executive leadership, are essential to Kroger’s performance. We believe our management compensation programs contribute to our ability to differentiate our performance from others in the marketplace. We will continue to administer our compensation program in a manner that we believe will be in the shareholders’ interests.

| INDEXED RETURNS Years Ending | |||||||||||||||||||||||||||
|---|---|---|---|---|---|---|---|---|---|---|---|---|---|---|---|---|---|---|---|---|---|---|---|---|---|---|---|
| Company Name / Index | | Base Period 2000 | | 2001 | | 2002 | | 2003 | | 2004 | | 2005 | |||||||||||||||
THE KROGER CO | 100 | 82.61 | 61.32 | 75.29 | 70.05 | 75.46 | |||||||||||||||||||||
S&P 500 INDEX | 100 | 83.99 | 66.77 | 89.85 | 94.65 | 105.66 | |||||||||||||||||||||
PEER GROUP | 100 | 100.68 | 76.57 | 89.33 | 95.64 | 93.76 | |||||||||||||||||||||
| Years of Service | ||||||||||||||||||||||||||||
|---|---|---|---|---|---|---|---|---|---|---|---|---|---|---|---|---|---|---|---|---|---|---|---|---|---|---|---|---|
| Five Year Average Remuneration | 15 | 20 | 25 | 30 | 35 | 40 | ||||||||||||||||||||||
| $ | 150,000 | $ | 33,750 | $ | 45,000 | $ | 56,250 | $ | 67,500 | $ | 78,750 | $ | 90,000 | |||||||||||||||
| 250,000 | 56,250 | 75,000 | 93,750 | 112,500 | 131,250 | 150,000 | ||||||||||||||||||||||
| 450,000 | 101,250 | 135,000 | 168,750 | 202,500 | 236,250 | 270,000 | ||||||||||||||||||||||
| 650,000 | 146,250 | 195,000 | 243,750 | 292,500 | 341,250 | 390,000 | ||||||||||||||||||||||
| 850,000 | 191,250 | 255,000 | 318,750 | 382,500 | 446,250 | 510,000 | ||||||||||||||||||||||
| 900,000 | 202,500 | 270,000 | 337,500 | 405,000 | 472,500 | 540,000 | ||||||||||||||||||||||
| 1,200,000 | 270,000 | 360,000 | 450,000 | 540,000 | 630,000 | 720,000 | ||||||||||||||||||||||
| 1,500,000 | 337,500 | 450,000 | 562,500 | 675,000 | 787,500 | 900,000 | ||||||||||||||||||||||
| 1,800,000 | 405,000 | 540,000 | 675,000 | 810,000 | 945,000 | 1,080,000 | ||||||||||||||||||||||
| 2,200,000 | 495,000 | 660,000 | 825,000 | 990,000 | 1,155,000 | 1,320,000 | ||||||||||||||||||||||
22
a change in control of Kroger (as defined in the plan). Participants who are at least 40 and who have more than six years of service are entitled to severance pay ranging from approximately 9 to 20 months’ salary and bonus. The actual amount is dependent upon pay level and other benefits. KEPP can be amended or terminated by the Board at any time prior to a change in control. It will expire in 2008 unless renewed by the Board.
Stock option and restricted stock agreements with participants in Kroger’s long-term incentive plans provide that those awards “vest,” with options becoming immediately vested and restrictions on restricted stock lapsing, upon a change in control as described in the agreements.
None of the named executive officers is party to an employment agreement. The CEO did have an employment contract that expired on November 30, 2006, and was not renewed.
PERQUISITES
The Committee does not believe that it is necessary for the attraction or retention of management talent to provide the named executive officers a substantial amount of compensation in the form of perquisites.In 2006, the only perquisites provided were:
- personal use of Kroger aircraft, which officers may lease from Kroger, and pay the average variable cost of operating the aircraft, making officers more available and allowing for a more efficient use of their time,
- payments of premiums of life insurance policies, and reimbursement of the tax effects of those payments,
- reimbursement for the tax effects of participation in a non-qualified retirement plan, and
- reimbursement of up to $4,500 for financial planning services, which reimbursement has been discontinued in 2007.
The total amount of perquisites furnished to the named executive officers is shown in the Summary Compensation table and described in more detail in footnote 5 to that table.
SECTION 162(M)OFTHE INTERNAL REVENUE CODE
Tax laws place a limit of $1,000,000 on the amount of some types of compensation for the CEO and the next four most highly compensated officers that is tax deductible by Kroger. Compensation that is deemed to be “performance-based” is excluded for purposes of the calculation and is tax deductible.Awards under Kroger’s long-term incentive plans, when payable upon achievement of stated performance criteria, should be considered performance-based and the compensation paid under those plans should be tax deductible. Generally, compensation expense related to stock options awarded to the CEO and the next four most highly compensated officers should be deductible. On the other hand, Kroger’s awards of restricted stock that vest solely upon the passage of time and are not performance-based. As a result, compensation expense for those awards to the CEO and the next four most highly compensated officers would not be deductible.
Although Kroger’s bonus plans are not discretionary but rather rely on performance criteria, these plans have not been approved by shareholders in the past. As a result, they currently do not satisfy the Internal Revenue Code’s requirements for deductibility. At the 2007 annual meeting of shareholders Kroger is submitting for approval of shareholders (see Item No. 2 below) its cash bonus plan. If approved by shareholders, bonuses paid under the plan to the CEO and the next four most highly compensated officers will be deductible by Kroger. In Kroger’s case, this group of individuals is not identical to the group of named executive officers.
23
| Kroger’s policy is, primarily, to design and administer compensation plans that support the achievement of long-term strategic objectives and enhance shareholder value. Where it is material and supports Kroger’s compensation philosophy, the Committee also will attempt to maximize the amount of compensation expense that is deductible by Kroger. |
COMPENSATION COMMITTEE REPORT
The Compensation Committee has reviewed and discussed with management of the Company the Compensation Discussion and Analysis contained in this proxy statement. Based on its review and discussions with management, the Compensation Committee has recommended to the Company’s Board of Directors that the Compensation Discussion and Analysis be included in the Company’s proxy statement and incorporated by reference into its annual report on Form 10-K.
Compensation Committee:
John T. LaMacchia, Chair
Robert D. Beyer
John L. Clendenin
Jorge P. Montoya
Clyde R. Moore
James A. Runde
24
SUMMARY COMPENSATION TABLE
The following table shows the compensation of the Chief Executive Officer, Chief Financial Officer and each of the Company’s three most highly compensated executive officers other than the CEO and CFO (the “named executive officers”) during fiscal 2006. Fiscal year 2006 consisted of 53 weeks.
| SUMMARY COMPENSATION TABLE | |||||||||||||||||||||||||||||
| Change in | |||||||||||||||||||||||||||||
| �� | Pension | ||||||||||||||||||||||||||||
| Value and | |||||||||||||||||||||||||||||
| Nonqualified | |||||||||||||||||||||||||||||
| Non-Equity | Deferred | ||||||||||||||||||||||||||||
| Stock | Option | Incentive Plan | Compensation | All Other | |||||||||||||||||||||||||
| Name and Principal | Salary | Bonus | Awards | Awards | Compensation | Earnings | Compensation | Total | |||||||||||||||||||||
| Position | Year | ($) | ($) | ($) | ($) | ($) | ($) | ($) | ($) | ||||||||||||||||||||
| (1) | (1) | (2) | (3) | (4) | |||||||||||||||||||||||||
| David B. Dillon | |||||||||||||||||||||||||||||
| Chairman and CEO | 2006 | $ | 1,155,991 | — | $ | 519,160 | $ | 3,311,870 | $ | 2,116,770 | $ | 1,008,309 | $ | 142,437 | $8,254,537 | ||||||||||||||
| J. Michael Schlotman | |||||||||||||||||||||||||||||
| Senior Vice | |||||||||||||||||||||||||||||
| President and CFO | 2006 | $ | 499,099 | — | $ | 97,835 | $ | 339,653 | $ | 635,031 | $ | 256,221 | $ | 31,819 | $1,859,658 | ||||||||||||||
| W. Rodney McMullen | |||||||||||||||||||||||||||||
| Vice Chairman | 2006 | $ | 809,969 | — | $ | 195,956 | $ | 794,327 | $ | 1,340,621 | $ | 360,184 | $ | 44,530 | $3,545,587 | ||||||||||||||
| Don W. McGeorge | |||||||||||||||||||||||||||||
| President and COO | 2006 | $ | 809,969 | — | $ | 195,956 | $ | 811,355 | $ | 1,340,621 | $ | 698,272 | $ | 83,891 | $3,940,064 | ||||||||||||||
| Donald E. Becker | |||||||||||||||||||||||||||||
| Executive Vice | |||||||||||||||||||||||||||||
| President | 2006 | $ | 575,413 | — | $ | 533,782 | $ | 576,090 | $ | 767,496 | $ | 711,031 | $ | 87,552 | $3,251,364 | ||||||||||||||
| (1) | This amount represents the dollar amount recognized for financial statement reporting purposes with respect to the fiscal year in accordance with FAS 123(R). See discussion of the assumptions made in the valuation in Note 10 to the financial statements in the Company’s Form 10-K filed with the SEC on April 4, 2007. Expense excludes 6.5% estimate of forfeitures, but includes an acceleration of expense for options granted to those reaching age 55 with at least five years of service. The named executive officers had no forfeitures in 2006. | |
| (2) | The Compensation Committee awarded a 141.118% payout for the executive officers including the named executive officers, in accordance with the terms of the 2006 performance-based cash bonus program. | |
| (3) | All amounts are attributable to change in pension value. During 2006, pension values increased significantly primarily due to increases in final average earnings used in determining pension benefits. Since the benefits are based on final average earnings and service, the effect of the final average earnings increase is larger for those with longer service. Please refer to the Pension Benefits table for further information regarding credited service. The Company does not provide any above-market or preferential earnings on nonqualified deferred compensation. | |
| (4) | These amounts include the reimbursement of life insurance premiums in the amounts of $69,435, $16,745, $22,221, $44,213 and $43,187 for Mr. Dillon, Mr. Schlotman, Mr. McMullen, Mr. McGeorge and Mr. Becker, respectively. These amounts also include reimbursement for the tax effects of paying such premiums in the amounts of $43,321, $9,704, $13,438, $25,761 and $26,945 for Mr. Dillon, Mr. Schlotman, Mr. McMullen, Mr. McGeorge and Mr. Becker, respectively. These amounts further include reimbursement for the tax effects of participation in a nonqualified retirement plan |
25
in the amounts of $16,885, $5,370, $8,871, $13,649, and $16,931 for Mr. Dillon, Mr. Schlotman, Mr. McMullen, Mr. McGeorge, and Mr. Becker, respectively. For Mr. Dillon and Mr. Becker these amounts also include the value of financial planning services in the amounts of $4,500 and $489, respectively. Reimbursement for financial planning services has been discontinued in 2007. Excluded from these totals is income imputed to the named executive officer when accompanied on our aircraft during business travel by non-business travelers. These amounts for Mr. Dillon and Mr. McGeorge, calculated using the applicable terminal charge and Standard Industry Fare Level (SIFL) mileage rates, were $8,296 and $268, respectively. The other named executive officers had no such imputed income for 2006. Separately, we require that officers who make personal use of our aircraft reimburse us for the full amount of the variable cost associated with the operation of the aircraft on such flights in accordance with a time-sharing arrangement consistent with FAA regulations.
Kroger historically has paid incentive compensation to its named executive officers based on the extent to which objectives established by the Committee are achieved. This compensation has been referred to as “bonus” in prior year proxy statements, but is now categorized as “non-equity incentive plan compensation.”The amounts shown above as non-equity incentive plan compensation reflect the compensation earned in 2006 and payable in 2007. Kroger and Mr. Dillon were parties to a five-year employment agreement that expired on November 30, 2006 and was not renewed. Restricted stock awards were granted under a long-term incentive plan, and restrictions on those shares lapse with the passage of time.
26
GRANTSOF PLAN-BASED AWARDS
The following table provides information about equity and non-equity awards granted to the named executive officers in 2006:
| 2006 GRANTS OF PLAN-BASED AWARDS | |||||||||||||||||
| All | All Other | ||||||||||||||||
| Other | Option | ||||||||||||||||
| Estimated | Stock | Awards: | |||||||||||||||
| Possible Payouts | Estimated | Awards: | Number | ||||||||||||||
| Under | Future Payouts | Number | of | Exercise | Grant | ||||||||||||
| Non-Equity | Under Equity | of | Securities | or Base | Date Fair | ||||||||||||
| Incentive Plan | Incentive Plan | Shares | Under- | Price of | Closing | Value of | |||||||||||
| Awards | Awards | of Stock | lying | Option | Market | Stock and | |||||||||||
| Grant | Target | Target | or Units | Options | Awards | Price | Option | ||||||||||
| Name | Date | ($) | (#) | (#) | (#) | ($/Sh) | ($/Sh) | Awards | |||||||||
| (1) | (4) | ||||||||||||||||
| David B. Dillon | 1/29/2006 | $1,500,000 | |||||||||||||||
| 5/4/2006 | 120,000 | (2) | $2,392,800 | ||||||||||||||
| 5/4/2006 | 240,000 | (3) | $19.94 | $20.04 | $1,658,064 | ||||||||||||
| J. Michael Schlotman | 1/29/2006 | $ 450,000 | |||||||||||||||
| 5/4/2006 | 10,000 | (2) | $ 199,400 | ||||||||||||||
| 5/4/2006 | 20,000 | (3) | $19.94 | $20.04 | $ 138,172 | ||||||||||||
| W. Rodney McMullen | 1/29/2006 | $ 950,000 | |||||||||||||||
| 5/4/2006 | 30,000 | (2) | $ 598,200 | ||||||||||||||
| 5/4/2006 | 60,000 | (3) | $19.94 | $20.04 | $ 414,516 | ||||||||||||
| Don W. McGeorge | 1/29/2006 | $ 950,000 | |||||||||||||||
| 5/4/2006 | 30,000 | (2) | $ 598,200 | ||||||||||||||
| 5/4/2006 | 60,000 | (3) | $19.94 | $20.04 | $ 414,516 | ||||||||||||
| Donald E. Becker | 1/29/2006 | $ 543,868 | |||||||||||||||
| 5/4/2006 | 12,500 | (2) | $ 249,250 | ||||||||||||||
| 5/4/2006 | 25,000 | (3) | $19.94 | $20.04 | $ 172,715 | ||||||||||||
| (1) | These amounts represent the bonus base or potential of the respective named executive officer under the Company’s 2006 performance-based cash bonus program. As shown in the Summary Compensation table, actual payout was 141.118% of the bonus base of each named executive officer for 2006. | |
| (2) | This amount represents the number of restricted shares awarded under The Kroger Co. 2005 Long- Term Incentive Plan. | |
| (3) | This amount represents the number of stock options granted under The Kroger Co. 2005 Long-Term Incentive Plan. | |
| (4) | Options under The Kroger Co. 2005 Long-Term Incentive Plan are granted at fair market value of Kroger common stock on the date of the grant. Fair market value was defined as the average of the high and low trading prices of Kroger stock on the date of the grant. |
The Compensation Committee of the Board of Directors, and the independent members of the Board in the case of the CEO, established bonus bases, shown in this table as “target” amounts, for the non-equity incentive plan awards for the named executive officers. Amounts were payable to the extent that performance met specific objectives established at the beginning of the year. As described in the Compensation Discussion and Analysis, actual earnings can exceed the target amounts if performance exceeds the thresholds. Restrictions on restricted stock awards made to the named executive officers lapse in equal amounts on each of the five anniversaries of the date the award is made, as long as the officer is then in our employ. Any dividends declared on Kroger common stock are payable on restricted stock.
27
Non-qualified stock options granted to the named executive officers vest in equal amounts on each of the five anniversaries of the date of grant. Those options were granted at the fair market value of Kroger common stock on the date of the grant. Options are granted only on one of the pre-established regularly scheduled Board meeting dates.
OUTSTANDING EQUITYAWARDSAT FISCAL YEAR-END
The following table discloses outstanding equity-based incentive compensation awards for the named executive officers as of the end of fiscal year 2006. Each outstanding award is shown separately. Option awards include performance-based nonqualified stock options. The vesting schedule for each award is described in the footnotes to this table.
| OUSTANDING EQUITY AWARDS AT 2006 FISCAL YEAR-END | |||||||||||||||||||||
| Option Awards | Stock Awards | ||||||||||||||||||||
| Equity | |||||||||||||||||||||
| Equity | Incentive | ||||||||||||||||||||
| Incentive | Plan | ||||||||||||||||||||
| Plan | Awards: | ||||||||||||||||||||
| Awards: | Market | ||||||||||||||||||||
| Number | or Payout | ||||||||||||||||||||
| Equity | of | Value of | |||||||||||||||||||
| Incentive | Unearned | Unearned | |||||||||||||||||||
| Plan Awards: | Market | Shares, | Shares, | ||||||||||||||||||
| Number of | Number of | Number of | Number | Value of | Units or | Units or | |||||||||||||||
| Securities | Securities | Securities | of Shares | Shares or | Other | Other | |||||||||||||||
| Underlying | Underlying | Underlying | or Units of | Units of | Rights | Rights | |||||||||||||||
| Unexercised | Unexercised | Unexercised | Option | Stock That | Stock That | That | That | ||||||||||||||
| Options | Options | Unearned | Exercise | Option | Have Not | Have Not | Have Not | Have Not | |||||||||||||
| (#) | (#) | Options | Price | Expiration | Vested | Vested | Vested | Vested | |||||||||||||
| Name | Exercisable | Unexercisable | (#) | ($) | Date | (#) | ($) | (#) | ($) | ||||||||||||
| David B. Dillon | |||||||||||||||||||||
| 30,000 | $ | 13.44 | 5/15/2007 | 120,000(11) | $3,102,000 | ||||||||||||||||
| 35,000 | $ | 22.23 | 4/16/2008 | ||||||||||||||||||
| 35,000 | (6) | $ | 22.23 | 4/16/2008 | |||||||||||||||||
| 50,000 | $ | 27.17 | 5/27/2009 | ||||||||||||||||||
| 50,000 | (7) | $ | 27.17 | 5/27/2009 | |||||||||||||||||
| 175,000 | $ | 16.59 | 2/11/2010 | ||||||||||||||||||
| 35,000 | (8) | $ | 16.59 | 2/11/2010 | |||||||||||||||||
| 35,000 | $ | 24.43 | 5/10/2011 | ||||||||||||||||||
| 35,000 | (9) | $ | 24.43 | 5/10/2011 | |||||||||||||||||
| 56,000 | 14,000 | (1) | $ | 23.00 | 5/9/2012 | ||||||||||||||||
| 35,000 | (10) | $ | 23.00 | 5/9/2012 | |||||||||||||||||
| 168,000 | 42,000 | (2) | $ | 14.93 | 12/12/2012 | ||||||||||||||||
| 120,000 | 180,000 | (3) | $ | 17.31 | 5/6/2014 | ||||||||||||||||
| 60,000 | 240,000 | (4) | $ | 16.39 | 5/5/2015 | ||||||||||||||||
| 240,000 | (5) | $ | 19.94 | 5/4/2016 | |||||||||||||||||
28
OUSTANDING EQUITY AWARDS AT 2006 FISCAL YEAR-END Option Awards Stock Awards Equity Equity Incentive Incentive Plan Plan Awards: Awards: Market Number or Payout Equity of Value of Incentive Unearned Unearned Plan Awards: Market Shares, Shares, Number of Number of Number of Number Value of Units or Units or Securities Securities Securities of Shares Shares or Other Other Underlying Underlying Underlying or Units of Units of Rights Rights Unexercised Unexercised Unexercised Option Stock That Stock That That That Options Options Unearned Exercise Option Have Not Have Not Have Not Have Not (#) (#) Options Price Expiration Vested Vested Vested Vested Name Exercisable Unexercisable (#) ($) Date (#) ($) (#) ($) J. Michael Schlotman 9,000 $ 22.23 4/16/2008 8,000 (12) $206,800 9,000 (6) $ 22.23 4/16/2008 10,000 (11) $258,500 10,000 $ 27.17 5/27/2009 10,000 (7) $ 27.17 5/27/2009 50,000 $ 16.59 2/11/2010 10,000 (8) $ 16.59 2/11/2010 10,000 $ 24.43 5/10/2011 10,000 (9) $ 24.43 5/10/2011 16,000 4,000 (1) $ 23.00 5/9/2012 10,000 (10) $ 23.00 5/9/2012 48,000 12,000 (2) $ 14.93 12/12/2012 16,000 24,000 (3) $ 17.31 5/6/2014 8,000 32,000 (4) $ 16.39 5/5/2015 20,000 (5) $ 19.94 5/4/2016 W. Rodney McMullen 25,000 $ 13.44 5/15/2007 30,000 (11) $775,500 25,000 $ 13.44 5/15/2007 30,000 $ 22.23 4/16/2008 30,000 (6) $ 22.23 4/16/2008 30,000 $ 27.17 5/27/2009 30,000 (7) $ 27.17 5/27/2009 125,000 $ 16.59 2/11/2010 25,000 (8) $ 16.59 2/11/2010 25,000 $ 24.43 5/10/2011 25,000 (9) $ 24.43 5/10/2011 40,000 10,000 (1) $ 23.00 5/9/2012 25,000 (10) $ 23.00 5/9/2012 120,000 30,000 (2) $ 14.93 12/12/2012 30,000 45,000 (3) $ 17.31 5/6/2014 15,000 60,000 (4) $ 16.39 5/5/2015 60,000 (5) $ 19.94 5/4/2016
29
| OUSTANDING EQUITY AWARDS AT 2006 FISCAL YEAR-END | |||||||||||||||||||||||
| Option Awards | Stock Awards | ||||||||||||||||||||||
| Equity | |||||||||||||||||||||||
| Equity | Incentive | ||||||||||||||||||||||
| Incentive | Plan | ||||||||||||||||||||||
| Plan | Awards: | ||||||||||||||||||||||
| Awards: | Market | ||||||||||||||||||||||
| Number | or Payout | ||||||||||||||||||||||
| Equity | of | Value of | |||||||||||||||||||||
| Incentive | Unearned | Unearned | |||||||||||||||||||||
| Plan Awards: | Market | Shares, | Shares, | ||||||||||||||||||||
| Number of | Number of | Number of | Number | Value of | Units or | Units or | |||||||||||||||||
| Securities | Securities | Securities | of Shares | Shares or | Other | Other | |||||||||||||||||
| Underlying | Underlying | Underlying | or Units of | Units of | Rights | Rights | |||||||||||||||||
| Unexercised | Unexercised | Unexercised | Option | Stock That | Stock That | That | That | ||||||||||||||||
| Options | Options | Unearned | Exercise | Option | Have Not | Have Not | Have Not | Have Not | |||||||||||||||
| (#) | (#) | Options | Price | Expiration | Vested | Vested | Vested | Vested | |||||||||||||||
| Name | Exercisable | Unexercisable | (#) | ($) | Date | (#) | ($) | (#) | ($) | ||||||||||||||
| Don W. McGeorge | |||||||||||||||||||||||
| 18,000 | $ | 13.44 | 5/15/2007 | 30,000 | (11) | $ | 775,500 | ||||||||||||||||
| 18,000 | $ | 13.44 | 5/15/2007 | ||||||||||||||||||||
| 30,000 | $ | 14.77 | 7/17/2007 | ||||||||||||||||||||
| 22,500 | $ | 22.23 | 4/16/2008 | ||||||||||||||||||||
| 22,500 | (6) | $ | 22.23 | 4/16/2008 | |||||||||||||||||||
| 30,000 | $ | 27.17 | 5/27/2009 | ||||||||||||||||||||
| 30,000 | (7) | $ | 27.17 | 5/27/2009 | |||||||||||||||||||
| 125,000 | $ | 16.59 | 2/11/2010 | ||||||||||||||||||||
| 25,000 | (8) | $ | 16.59 | 2/11/2010 | |||||||||||||||||||
| 25,000 | $ | 24.43 | 5/10/2011 | ||||||||||||||||||||
| 25,000 | (9) | $ | 24.43 | 5/10/2011 | |||||||||||||||||||
| 40,000 | 10,000 | (1) | $ | 23.00 | 5/9/2012 | ||||||||||||||||||
| 25,000 | (10) | $ | 23.00 | 5/9/2012 | |||||||||||||||||||
| 120,000 | 30,000 | (2) | $ | 14.93 | 12/12/2012 | ||||||||||||||||||
| 30,000 | 45,000 | (3) | $ | 17.31 | 5/6/2014 | ||||||||||||||||||
| 15,000 | 60,000 | (4) | $ | 16.39 | 5/5/2015 | ||||||||||||||||||
| 60,000 | (5) | $ | 19.94 | 5/4/2016 | |||||||||||||||||||
| Donald E. Becker | |||||||||||||||||||||||
| 18,000 | $ | 13.44 | 5/15/2007 | 5,000 | (13) | $ | 129,250 | ||||||||||||||||
| 18,000 | $ | 22.23 | 4/16/2008 | 40,000 | (14) | $ | 1,034,000 | ||||||||||||||||
| 0 | 18,000 | (6) | $ | 22.23 | 4/16/2008 | 12,500 | (11) | $ | 323,125 | ||||||||||||||
| 18,000 | $ | 27.17 | 5/27/2009 | ||||||||||||||||||||
| 0 | 18,000 | (7) | $ | 27.17 | 5/27/2009 | ||||||||||||||||||
| 75,000 | $ | 16.59 | 2/11/2010 | ||||||||||||||||||||
| 0 | 15,000 | (8) | $ | 16.59 | 2/11/2010 | ||||||||||||||||||
| 12,500 | $ | 24.43 | 5/10/2011 | ||||||||||||||||||||
| 0 | 12,500 | (9) | $ | 24.43 | 5/10/2011 | ||||||||||||||||||
| 21,333 | 5,334 | (1) | $ | 23.00 | 5/9/2012 | ||||||||||||||||||
| 0 | 13,333 | (10) | $ | 23.00 | 5/9/2012 | ||||||||||||||||||
| 64,000 | 16,000 | (2) | $ | 14.93 | 12/12/2012 | ||||||||||||||||||
| 16,000 | 24,000 | (3) | $ | 17.31 | 5/6/2014 | ||||||||||||||||||
| 8,000 | 32,000 | (4) | $ | 16.39 | 5/5/2015 | ||||||||||||||||||
| 0 | 25,000 | (5) | $ | 19.94 | 5/4/2016 | ||||||||||||||||||
30
____________________
| (1) | Stock options vest on 5/9/2007. | |
| (2) | Stock options vest on 12/12/2007. | |
| (3) | Stock options vest at the rate of 20%/year with vesting dates of 5/6/2007, 5/6/2008 and 5/6/2009. | |
| (4) | Stock options vest at the rate of 20%/year with vesting dates of 5/5/2007, 5/5/2008, 5/5/2009 and 5/5/2010. | |
| (5) | Stock options vest at a rate of 20%/year with vesting dates of 5/4/2007, 5/4/2008, 5/4/2009, 5/4/2010 and 5/4/2011. | |
| (6) | Performance stock options vest on 10/16/2007 or earlier if performance criteria is satisfied prior to such date. | |
| (7) | Performance stock options vest on 11/27/2008 or earlier if performance criteria is satisfied prior to such date. | |
| (8) | Performance stock options vest on 8/11/2009 or earlier if performance criteria is satisfied prior to such date. | |
| (9) | Performance stock options vest on 11/10/2010 or earlier if performance criteria is satisfied prior to such date. | |
| (10) | Performance stock options vest on 11/9/2011 or earlier if performance criteria is satisfied prior to such date. | |
| (11) | Restricted stock vests at the rate of 20%/year with vesting dates of 5/4/2007, 5/4/2008, 5/4/2009, 5/4/2010 and 5/4/2011. | |
| (12) | Restricted stock vests on 5/9/2007. | |
| (13) | Restricted stock vests on 9/17/2007. | |
| (14) | Restricted stock vests as follows: 10,000 shares on 12/10/2007 and 30,000 shares on 12/8/2008. |
From 1997 through 2002, Kroger granted to the named executive officers performance-based nonqualified stock options. These options, having a term of ten years, vest six months prior to their date of expiration unless earlier vesting because Kroger’s stock price has achieved the specified annual rate of appreciation set forth in the stock option agreement. That rate ranged from 13 to 16%. To date, only the performance-based options granted in 1997 have vested.
OPTION EXERCISESAND STOCK VESTED
The following table provides the stock options exercised and restricted stock vested during 2006.
| 2006 OPTION EXERCISE AND STOCK VESTED | |||||||||
| Option Awards | Stock Awards | ||||||||
| Number of | Value | Number of | Value | ||||||
| Shares Acquired | Realized on | Shares Acquired | Realized on | ||||||
| on Exercise | Exercise | on Vesting | Vesting | ||||||
| Name | (#) | ($) | (#) | ($) | |||||
| David B. Dillon | 30,000 | $ | 247,950 | 75,000 | $ | 1,555,500 | |||
| J. Michael Schlotman | 18,000 | $ | 148,703 | 15,800 | $ | 326,725 | |||
| W. Rodney McMullen | 60,000 | $ | 607,800 | 50,000 | $ | 1,037,000 | |||
| Don W. McGeorge | 24,000 | $ | 268,874 | 50,000 | $ | 1,037,000 | |||
| Donald E. Becker | 66,000 | $ | 686,680 | 12,500 | $ | 287,925 | |||
Options granted under our various long-term incentive plans have a ten-year life and expire if not exercised within that ten year period.
31
PENSION BENEFITS
The following table provides information on pension benefits as of 2006 year-end for the named executive officers.
| 2006 PENSION BENEFITS | |||||||
| Number | Present | Payments | |||||
| of Years | Value of | During | |||||
| Credited | Accumulated | Last Fiscal | |||||
| Service | Benefit | Year | |||||
| Name | Plan Name | (#) | ($) | ($) | |||
| David B. Dillon | The Kroger Consolidated Retirement Benefit Plan | 11 | $ | 214,080 | $0 | ||
| The Kroger Co. Excess Benefit Plan | 11 | $ | 1,690,013 | $0 | |||
| Dillon Companies, Inc. Excess Benefit Pension Plan | 20 | $ | 1,106,543 | $0 | |||
| J. Michael Schlotman | The Kroger Consolidated Retirement Benefit Plan | 21 | $ | 280,755 | $0 | ||
| The Kroger Co. Excess Benefit Plan | 21 | $ | 560,846 | $0 | |||
| W. Rodney McMullen | The Kroger Consolidated Retirement Benefit Plan | 21 | $ | 247,540 | $0 | ||
| The Kroger Co. Excess Benefit Plan | 21 | $ | 1,278,621 | $0 | |||
| Don W. McGeorge | The Kroger Consolidated Retirement Benefit Plan | 27 | $ | 426,158 | $0 | ||
| The Kroger Co. Excess Benefit Plan | 27 | $ | 2,182,611 | $0 | |||
| Donald E. Becker | The Kroger Consolidated Retirement Benefit Plan | 32 | $ | 714,465 | $0 | ||
| The Kroger Co. Excess Benefit Plan | 32 | $ | 1,982,339 | $0 | |||
The named executive officers all participate in The Kroger Consolidated Retirement Benefit Plan (the “Consolidated Plan”), which is a qualified defined benefit pension plan. The Consolidated Plan generally determines accrued benefits using a cash balance formula, but retains benefit formulas applicable under prior plans for certain “grandfathered participants” who were employed by Kroger on December 31, 2000.Each of the named executive officers is eligible for these grandfathered benefits under the Consolidated Plan. Therefore, their benefits are determined using formulas applicable under prior plans, including the Kroger formula covering service to The Kroger Co. and the Dillon Companies, Inc. Pension Plan formula covering service to Dillon Companies, Inc.
The named executive officers also are eligible to receive benefits under The Kroger Co. Excess Benefit Plan (the “Kroger Excess Plan”), and Mr. Dillon also is eligible to receive benefits under the Dillon Companies, Inc. Excess Benefit Pension Plan ( the “Dillon Excess Plan”). These plans are collectively referred to as the “Excess Plans.” The Excess Plans are each considered to be nonqualified deferred compensation plans as defined in Section 409A of the Internal Revenue Code (subject to applicable transition rules). The purpose of the Excess Plans is to make up the shortfall in retirement benefits caused by the limitations on benefits to highly compensated individuals under qualified plans in accordance with the Internal Revenue Code.
Each of the named executive officers will receive benefits under the Consolidated Plan and the Excess Plans, determined as follows:
- 1½% times years of credited service multiplied by the average of the highest five consecutive years of total earnings during the last ten calendar years of employment, reduced by 1¼% times years of credited service multiplied by the primary social security benefit;
- normal retirement age is 65;
- unreduced benefits are payable beginning at age 62; and
32
- benefits payable between ages 55 and 62 will be reduced by 1/3 of one percent for each of the first 24 months and by ½ of one percent for each of the next 60 months by which the commencement of benefits precedes age 62.
Although participants generally receive credited service beginning at age 21, those participants who commenced employment prior to 1986, including all of the named executive officers, began to accrue credited service after attaining age 25. In the event of a termination of employment, Mr. Becker and Mr. Dillon currently are eligible for a reduced early retirement benefit, as they each have attained age 55.
Mr. Dillon also participates in the Dillon Employees’ Profit Sharing Plan (the “Dillon Plan”). The Dillon Plan is a qualified defined contribution plan under which Dillon Companies, Inc. and its participating subsidiaries may choose to make discretionary contributions each year that are then allocated to each participant’s account. Participation in the Dillon Plan was frozen effective January 1, 2001. Participants in the Dillon Plan elect from among a number of investment options and the amounts in their accounts are invested and credited with investment earnings in accordance with their elections. Prior to July 1, 2000, participants could elect to make voluntary contributions under the Dillon Plan, but that option was discontinued effective as of July 1, 2000. Participants can elect to receive their Dillon Plan benefit in the form of either a lump sum payment or installment payments.
Due to offset formulas contained in the Consolidated Plan and the Dillon Excess Plan, Mr. Dillon’s accrued benefit under the Dillon Plan offsets a portion of the benefit that would otherwise accrue for him under those plans for his service with Dillon Companies, Inc. Although benefits that accrue under defined contribution plans are not reportable under the accompanying table, we have added narrative disclosure of the Dillon Plan because of the offsetting effect that benefits under that plan has on benefits accruing under the Consolidated Plan and the Dillon Excess Plan.
NONQUALIFIED DEFERRED COMPENSATION
The following table provides information on non-qualified deferred compensation for the named executive officers for 2006.
| 2006 NONQUALIFIED DEFERRED COMPENSATION | |||||||||||||
| Executive | Registrant | Aggregate | Aggregate | Aggregate | |||||||||
| Contributions | Contributions | Earnings | Withdrawals/ | Balance at | |||||||||
| in Last FY | in Last FY | in Last FY | Distributions | Last FYE | |||||||||
| Name | ($) | ($) | ($) | ($) | ($) | ||||||||
| David B. Dillon | $ | 0 | $0 | $ | 36,923 | $0 | $ | 523,545 | |||||
| J. Michael Schlotman | $ | 0 | $0 | $ | 0 | $0 | $ | 0 | |||||
| W. Rodney McMullen | $ | 97,578 | (1) | $0 | $ | 193,796 | $0 | $ | 2,797,375 | ||||
| Don W. McGeorge | $ | 0 | $0 | $ | 13,362 | $0 | $ | 165,313 | |||||
| Donald E. Becker | $ | 0 | $0 | $ | 0 | $0 | $ | 0 | |||||
| (1) | This amount was included in the executive’s base salary in the Summary Compensation table. |
33
Eligible participants may elect to defer up to 100% of the amount of their salary that exceeds the sum of the FICA wage base and pre-tax insurance and other Internal Revenue Code Section 125 plan deductions, as well as 100% of their annual bonus compensation. Deferral account amounts are credited with interest at the rate representing Kroger’s cost of 10-year debt as determined by Kroger’s CEO prior to the beginning of each deferral year. The interest rate established for deferral amounts for each deferral year will be applied to those deferral amounts for all subsequent years until the deferred compensation is paid out. Participants can elect to receive lump sum distributions or quarterly installments for periods up to ten years. Participants also can elect between lump sum distributions and quarterly installments to be received by designated beneficiaries if the participant dies before distribution of deferred compensation is completed.
DIRECTOR COMPENSATION
The following table describes the fiscal year 2006 compensation for non-employee directors. Employee directors receive no compensation for their Board service. Fiscal year 2006 consisted of 53 weeks.
| 2006 DIRECTOR COMPENSATION | |||||||||||||||||||||||
| Change in | |||||||||||||||||||||||
| Pension | |||||||||||||||||||||||
| Value and | |||||||||||||||||||||||
| Fees | Nonqualified | ||||||||||||||||||||||
| Earned | Non-Equity | Deferred | |||||||||||||||||||||
| or Paid | Stock | Incentive Plan | Compensation | All Other | |||||||||||||||||||
| in Cash | Awards | Option | Compensation | Earnings | Compensation | Total | |||||||||||||||||
| Name | ($) | ($) | Awards($) | ($) | ($) | ($) | ($) | ||||||||||||||||
| (3) | (4) | (13) | (14) | ||||||||||||||||||||
| Reuben V. Anderson | $ | 85,482 | $ | 54,988 | (5) | $ | 74,262 | (7) | $0 | $ | 6,300 | $ | 108 | $ | 221,140 | ||||||||
| Robert D. Beyer | $ | 88,430 | $ | 54,988 | (5) | $ | 35,516 | (8) | $0 | N/A | $ | 108 | $ | 179,042 | |||||||||
| John L. Clendenin | $ | 76,233 | $ | 54,988 | (5) | $ | 74,262 | (7) | $0 | $ | 5,000 | $ | 108 | $ | 210,591 | ||||||||
| John T. LaMacchia | $ | 88,430 | $ | 54,988 | (5) | $ | 74,262 | (7) | $0 | $ | 7,900 | $ | 108 | $ | 225,688 | ||||||||
| David B. Lewis | $ | 98,594 | $ | 54,988 | (5) | $ | 72,504 | (9) | $0 | N/A | $ | 108 | $ | 226,194 | |||||||||
| Clyde R. Moore | $ | 86,397 | $ | 54,988 | (5) | $ | 38,017 | (10) | $0 | $ | 7,200 | $ | 108 | $ | 186,710 | ||||||||
| Katherine D. Ortega | $ | 88,430 | $ | 54,988 | (5) | $ | 74,262 | (7) | $0 | $ | 6,700 | $ | 108 | $ | 224,488 | ||||||||
| Susan M. Phillips | $ | 86,315 | $ | 54,988 | (5) | $ | 30,057 | (11) | $0 | N/A | $ | 108 | $ | 171,468 | |||||||||
| Steven R. Rogel | $ | 98,594 | $ | 54,988 | (5) | $ | 74,262 | (8) | $0 | N/A | $ | 108 | $ | 227,952 | |||||||||
| James Runde(1) | $ | 31,866 | $ | 4,576 | (6) | $ | 1,342 | (12) | $0 | N/A | $ | 0 | $ | 37,784 | |||||||||
| Ronald L. Sargent(2) | $ | 12,620 | $ | 4,576 | (6) | $ | 1,271 | (12) | $0 | N/A | $ | 0 | $ | 18,467 | |||||||||
| Bobby S. Shackouls | $ | 86,397 | $ | 54,988 | (5) | $ | 74,262 | (8) | $0 | N/A | $ | 108 | $ | 215,755 | |||||||||
| (1) | Board member as of September 1, 2006. | |
| (2) | Board member as of December 7, 2006. | |
| (3) | This amount represents the dollar amount recognized for financial statement reporting purposes with respect to the fiscal year in accordance with FAS 123(R). See discussion of the assumptions made in the valuation in Note 10 to the financial statements in the Company’s Form 10-K filed with the SEC on April 4, 2007. Expense excludes 6.5% estimate of forfeitures, but includes an acceleration of expense for options granted to those reaching age 55 with at least five years of service. The grant date fair value of the annual award of 2,500 shares of restricted stock to each Board member on December 7, 2006 was $57,750. | |
| (4) | This amount represents the dollar amount recognized for financial statement reporting purposes with respect to the fiscal year in accordance with FAS 123(R). See discussion of the assumptions made in the valuation in Note 10 to the financial statements in the Company’s Form 10-K filed with the SEC on April 4, 2007. The grant date fair value of the annual award of 5,000 stock options to each Board member on December 7, 2006 was $40,017. |
34
| (5) | Aggregate stock awards outstanding at fiscal year end was 3,750 shares. | |
| (6) | Aggregate stock awards outstanding at fiscal year end was 2,500 shares. | |
| (7) | Aggregate stock options outstanding at fiscal year end was 41,000 shares. | |
| (8) | Aggregate stock options outstanding at fiscal year end was 33,000 shares. | |
| (9) | Aggregate stock options outstanding at fiscal year end was 25,000 shares. | |
| (10) | Aggregate stock options outstanding at fiscal year end was 37,000 shares. | |
| (11) | Aggregate stock options outstanding at fiscal year end was 20,000 shares. | |
| (12) | Aggregate stock options outstanding at fiscal year end was 5,000 shares. | |
| (13) | These amounts only reflect the change in pension value for the applicable directors. Only those directors elected to the Board prior to July 17, 1997 are eligible to participate in the outside director retirement plan. The Company does not provide above-market or preferential earnings on nonqualified deferred compensation. | |
| (14) | This amount reflects the cost to the Company per director for providing accidental death and disability insurance coverage for outside directors. These premiums are paid on an annual basis in February. |
Each non-employee director receives an annual retainer of $75,000. The chair of each committee receives an additional annual retainer of $12,000. Each member of the Audit Committee, as well as the director designated as the “Lead Director,” receives an additional annual retainer of $10,000. Each non-employee director also receives annually, at the regularly scheduled meeting held in December, an award of 2,500 shares of restricted stock and 5,000 non-qualified stock options.
Outside directors first elected prior to July 17, 1997 receive a major medical plan benefit as well as an unfunded retirement benefit. The retirement benefit equals the average cash compensation for the five calendar years preceding retirement. Participants who retire from the Board prior to age 70 will be credited with 50% vesting after five years of service, and 10% for each additional year up to a maximum of 100%. Benefits for participants who retire prior to age 70 begin at the later of actual retirement or age 65.
We also maintain a deferred compensation plan, in which all non-employee members of the Board are eligible to participate. Participants may defer up to 100% of their cash compensation. They may elect from either or both of the following two alternative methods of determining benefits:
- interest accrues during the deferral year based on that rate of interest determined at the beginning of the deferral year to equal our cost of ten-year debt; and
- amounts are credited in “phantom” stock accounts and the amounts in those accounts fluctuate with the price of Kroger common stock.
In both cases, deferred amounts are paid out only in cash, based on deferral options selected by the participants at the time the deferral elections are made. Participants can elect to have distributions made in a lump sum or in quarterly installments, and may make comparable elections for designated beneficiaries who receive benefits in the event that deferred compensation is not completely paid out upon the death of the participant.
During 2004, the Corporate Governance Committee retained Mercer Human Resource Consulting to review non-employee director compensation. The consultant determined that Kroger’s non-employee director compensation was significantly below median compensation of non-employee directors at other publicly held U.S. corporations, and therefore not competitive. Based on this evaluation, the Corporate Governance Committee recommended to the Board, and the Board approved, an increase in non-employee director compensation effective as of January 2005. The Board has determined that compensation of non-
35
employee directors must be competitive on an on-going basis to attract and retain directors who meet the qualifications for service on Kroger’s Board. Non-employee director compensation will be reviewed from time to time as the Corporate Governance Committee deems appropriate.
POTENTIAL PAYMENTS UPON TERMINATIONOR CHANGEIN CONTROL
Kroger has no contracts, agreements, plans or arrangements that in connection with resignation, severance, retirement, termination, or change in control, provide for payments to its named executive officers that are not available generally to salaried employees. Mr. Dillon had an employment agreement that expired on November 30, 2006 and was not renewed. Kroger’s non-discriminatory change in control benefits under The Kroger Co. Employee Protection Plan and under stock option and restricted stock agreements are discussed further in the Compensation Discussion and Analysis section under the “Retirement and other benefits” heading.
BENEFICIAL OWNERSHIPOF COMMON STOCK
As of March 8, 2006,February 12, 2007, Kroger’s directors, the named executive officers and the directors and executive officers as a group, beneficially owned shares of Kroger’s common stock as follows:
| Name | | Amount and Nature of Beneficial Ownership | ||
|---|---|---|---|---|
| Reuben V. Anderson | 51,245 | (1) | ||
| Donald E. Becker | 365,485 | (2)(7)(11) | ||
| Robert D. Beyer | 47,912 | (3) | ||
| John L. Clendenin | 56,100 | (4) | ||
| David B. Dillon .. | 1,580,759 | (2)(8)(11) | ||
| Paul W. Heldman | 536,883 | (2)(9)(11) | ||
| Michael S. Heschel | 653,463 | (2)(11) | ||
| John T. LaMacchia | 61,100 | (4) | ||
| David B. Lewis .. | 14,000 | (5) | ||
| Don W. McGeorge | 673,815 | (2)(10)(11) | ||
| W. Rodney McMullen | 877,079 | (2)(11) | ||
| Clyde R. Moore .. | 33,100 | (4) | ||
| Katherine D. Ortega | 58,456 | (1) | ||
| Susan M. Phillips | 16,500 | (6) | ||
| Steven R. Rogel | 35,128 | (3) | ||
| Bobby S. Shackouls | 22,100 | (3) | ||
| Directors and Executive Officers as a group (including those named above) | 7,055,305 | (2)(12)(13) | ||
| Amount and Nature | ||
| of | ||
Name | Beneficial Ownership | |
| Reuben V. Anderson | 58,145 | (1) |
| Donald E. Becker | 376,708 | (2)(3)(4) |
| Robert D. Beyer | 54,812 | (5) |
| John L. Clendenin | 63,000 | (1) |
| David B. Dillon | 1,667,446 | (2)(4)(6) |
| John T. LaMacchia | 68,000 | (1) |
| David B. Lewis | 20,500 | (7) |
| Don W. McGeorge | 697,997 | (2)(4)(8) |
| W. Rodney McMullen | 893,320 | (2)(4) |
| Clyde R. Moore | 47,500 | (9) |
| Katherine D. Ortega | 57,356 | (1) |
| Susan M. Phillips | 22,000 | (10) |
| Steven R. Rogel | 42,028 | (5) |
| James A. Runde | 2,500 | |
| Ronald L. Sargent | 4,500 | |
| J. Michael Schlotman | 242,994 | (2)(4)(11) |
| Bobby S. Shackouls | 29,000 | (5) |
| Directors and Executive Officers as a group (including those named above) | 6,874,249 | (2)(12) |
| (1) | This amount includes |
| (2) | This amount includes shares that represent options that are or become exercisable on or before |
36
| (3) |
| This amount includes 10,228 shares owned by Mr. Becker’s wife and 1,050 shares owned by his children. Mr. Becker disclaims beneficial ownership of these shares. |
| The fractional interest resulting from allocations under Kroger’s defined contribution plans has been rounded to the nearest whole number. |
| (5) | This amount includes 17,000 shares that represent options that are or become exercisable on or before April 13, 2007. | |
| (6) | This amount includes 219,100 shares owned by Mr. Dillon’s wife and children, and 36,016 shares in his children’s trust. Mr. Dillon disclaims beneficial ownership of these shares. | |
| (7) | This amount includes 9,000 shares that represent options that are or become exercisable on or before April 13, 2007. | |
| (8) | This amount includes 10,152 shares owned by Mr. McGeorge’s wife. Mr. McGeorge disclaims beneficial ownership of these shares. | |
| (9) | This amount includes 21,000 shares that represent options that are or become exercisable on or before April 13, 2007 | |
| (10) | This amount includes 5,000 shares that represent options that are or become exercisable on or before April 13, 2007. | |
| (11) | This amount includes 2,005 shares owned by Mr. Schlotman’s children. Mr. Schlotman disclaims beneficial ownership of these shares. | |
| (12) | The figure shown includes an aggregate of |
No director or officer owned Kroger common stock pledged as security.
As of March 8, 2006,February 12, 2007, the following persons reported beneficial ownership of Kroger common stock based on reports on Schedule 13G filed with the Securities and Exchange Commission or other reliable information as follows:
| Name | | Address of Beneficial Owner | | Amount and Nature of Ownership | | Percentage of Class | ||||||||
|---|---|---|---|---|---|---|---|---|---|---|---|---|---|---|
| AXA Financial, Inc. | 1290 Avenue of the Americas New York, NY 10104 | 66,138,246 | 9.1 | % | ||||||||||
| Brandes Investment Partners, L.P. | 11988 El Camino Real, Suite 500 San Diego, CA 92130 | 53,100,578 | 7.3 | % | ||||||||||
| Lord, Abbett & Co. LLC | 90 Hudson Street Jersey City, NJ 07302 | 48,971,337 | 6.7 | % | ||||||||||
| The Kroger Co. Savings Plan | 1014 Vine Street Cincinnati, OH 45202 | 50,064,465 | (1) | 6.9 | % | |||||||||
| Amount and | |||||
| Nature of | Percentage | ||||
| Name | Address of Beneficial Owner | Ownership | of Class | ||
| 1290 Avenue of the Americas | |||||
| AXA Financial, Inc. | New York, NY 10104 | 66,457,092 | 9.4 | % | |
| 90 Hudson Street | |||||
| Lord, Abbett & Co. LLC | Jersey City, NJ 07302 | 46,202,740 | 6.5 | % | |
| 1014 Vine Street | |||||
| The Kroger Co. Savings Plan | Cincinnati, OH 45202 | 40,480,889 | (1) | 5.7 | % |
| (1) | Shares beneficially owned by plan trustees for the benefit of participants in employee benefit plans. |
37
RELATEDPERSONTRANSACTIONS
Pursuant to ourStatement of Policy with Respect to Related Person Transactionsand the rules of the SEC, Kroger has no related person transaction to disclose for purposes of this proxy statement. Director independence is discussed above under the heading “Information Concerning the Board of Directors.” Kroger’s policy on related person transactions is as follows:
STATEMENTOFPOLICY
WITHRESPECTTO
RELATEDPERSONTRANSACTIONS
A. INTRODUCTION
It is the policy of Kroger’s Board of Directors that any Related Person Transaction may be consummated or may continue only if the Audit Committee approves or ratifies the transaction in accordance with the guidelines set forth in this policy. The Board of Directors has determined that the Audit Committee of the Board is best suited to review and approve Related Person Transactions.
For the purposes of this policy, a Form 4 nine days late reporting“Related Person” is:
- any person who is, or at any time since the beginning of Kroger’s last fiscal year was, a
stock sale. Ms. M. Marnette Perry fileddirector or executive officer of Kroger or aForm 5 reportingnominee to become arestricted stock awarddirector of Kroger; - any person who is known to be the beneficial owner of more than 5% of any class of Kroger’s voting securities; and
- any immediate family member of any of the foregoing persons, which means any child, stepchild, parent, stepparent, spouse, sibling, mother-in-law, father-in-law, son-in-law, daughter-in-law, brother-in-law, or sister-in-law of the director, executive officer, nominee or more than 5% beneficial owner, and any person (other than a tenant or employee) sharing the household of such director, executive officer, nominee or more than 5% beneficial owner.
For the purposes of this policy, a “Related Person Transaction” is a transaction, arrangement or relationship (or any series of similar transactions, arrangements or relationships) since the beginning of Kroger’s last fiscal year in which Kroger (including any of its subsidiaries) was, is or will be a participant and the amount involved exceeds $120,000, and in which any Related Person had, has or will have a direct or indirect material interest (other than solely as a result of being a director or a less than 10 percent beneficial owner of another entity).
38
Notwithstanding the foregoing, the Audit Committee has reviewed the following types of transactions and has determined that inadvertently waseach type of transaction is deemed to be pre-approved, even if the amount involved exceeds $120,000.
| 1. | Certain Transactions with Other Companies. Any transaction for property or services in the ordinary course of business involving payments to or from another company at which a Related Person’s only relationship is as an employee (other than an executive officer), director, or beneficial owner of less than 10% of that company’s shares, if the aggregate amount involved in any fiscal year does not exceed the greater of $1,000,000 or 2 percent of that company’s annual consolidated gross revenues. | ||
| 2. | Certain Company Charitable Contributions. Any charitable contribution, grant or endowment by Kroger (or one of its foundations) to a charitable organization, foundation, university or other not for profit organization at which a Related Person’s only relationship is as an employee (other than an executive officer) or as a director, if the aggregate amount involved does not exceed $250,000 or 5 percent, whichever is lesser, of the charitable organization’s latest publicly available annual consolidated gross revenues. | ||
| 3. | Transactions where all Shareholders Receive Proportional Benefits. Any transaction where the Related Person’s interest arises solely from the ownership of Kroger common stock and all holders of Kroger common stock received the same benefit on a pro rata basis. | ||
| 4. | Executive Officer and Director Compensation. (a) Any employment by Kroger of an executive officer if the executive officer’s compensation is required to be reported in Kroger’s proxy statement, (b) any employment by Kroger of an executive officer if the executive officer is not an immediate family member of a Related Person and the Compensation Committee approved (or recommended that the Board approve) the executive officer’s compensation, and (c) any compensation paid to a director if the compensation is required to be reported in Kroger’s proxy statement. | ||
| 5. | Other Transactions. (a) Any transaction involving a Related Person where the rates or charges involved are determined by competitive bids, (b) any transaction with a Related Person involving the rendering of services as a common or contract carrier, or public utility, at rates or charges fixed in conformity with law or governmental authority, or (c) any transaction with a Related Person involving services as a bank depositary of funds, transfer agent, registrar, trustee under a trust indenture or similar services. | ||
B. AUDIT COMMITTEE APPROVAL
In the event management becomes aware of any Related Person Transactions that are not reporteddeemed pre-approved under paragraph A of this policy, those transactions will be presented to the Committee for approval at the next regular Committee meeting, or where it is not practicable or desirable to wait until the next regular Committee meeting, to the chair of the Committee (who will possess delegated authority to act between Committee meetings) subject to ratification by the Committee at its next regular meeting. If advance approval of a Related Person Transaction is not feasible, then the Related Person Transaction will be presented to the Committee for ratification at the next regular Committee meeting, or where it is not practicable or desirable to wait until the next regular Committee meeting, to the Chair of the Committee for ratification, subject to further ratification by the Committee at its next regular meeting.
39
In connection with each regular Committee meeting, a summary of each new Related Person Transaction deemed pre-approved pursuant to paragraphs A(1) and A(2) above will be provided to the Committee for its review.
If a Related Person Transaction will be ongoing, the Committee may establish guidelines for management to follow in 2003.
No director will participate in any discussion or approval of a Related Person Transaction for which he or she is a Related Person except that the director will provide all material information about the Related Person Transaction to the Committee.
C. D32ISCLOSURE
Kroger will disclose all Related Person Transactions in Kroger’s applicable filings as required by the Securities Act of 1933, the Securities Exchange Act of 1934 and related rules.
40
Bobby S. Shackouls, Vice Chair
Clyde R. Moore
Susan M. Phillips
Ronald L. Sargent
42
APPROVALOF KROGER CASH BONUS PLAN
(ITEM NO. 2)
Kroger historically has paid to associates at all levels an annual bonus designed to provide an incentive to achieve superior results.
This annual incentive plan provides pay based on the foregoing Auditextent to which Kroger meets objectives established at the beginning of each year. Kroger has not historically maintained a long-term incentive plan other than its broad-based equity compensation plans. After reviewing executive compensation with its outside advisors, the Compensation Committee Report norconcluded that the attached Auditlong-term component of Kroger’s executive compensation was not competitive. In 2006 the Board instituted a program of long-term bonuses covering periods in excess of one year under which a portion of compensation for about 140 key executives is conditioned on the achievement of those long-term goals. This program serves the dual purposes of making Kroger’s long-term compensation competitive and of providing incentives to meet long-term goals.
Some compensation plans must be approved by shareholders in order for certain compensation earned under those plans to be considered to be performance-based and therefore deductible for federal tax purposes under Section 162(m) of the Internal Revenue Code. At the Annual Meeting, shareholders are being asked to approve the Kroger Cash Bonus Plan (the “Bonus Plan”), in order for bonuses paid under the plan to satisfy the requirements for qualified performance-based compensation under the Internal Revenue Service’s regulations under Section 162(m) and to be eligible for deductibility by Kroger. Shareholders also are being asked to approve currently outstanding annual and long-term bonuses that are not yet due and payable because the performance periods have not yet been completed. Kroger’s Compensation Committee, Chartercomprised solely of independent directors, has approved the Bonus Plan.
DESCRIPTIONOFTHE BONUS PLAN
All Kroger associates who are not covered by a collective bargaining agreement are eligible to participate in the Bonus Plan. Currently participation is limited to executives, managers and certain hourly employees.
Bonus Awards
Types. Two types of bonuses can be awarded under the Bonus Plan; an annual bonus award for each fiscal year, and a long-term bonus award for measurement periods in excess of one year. Bonus payments are based on Kroger’s performance measured against criteria established by a committee of the Board of Directors (the “Committee”) that qualifies as a “compensation committee” under Section 162(m) of the Internal Revenue Code. The Committee establishes a bonus “potential” for each bonus payable under the Bonus Plan for each participant, based on the participant’s level within Kroger, and actual payouts can exceed that amount when Kroger’s performance exceeds the pre-established thresholds.
Business Criteria. Each participant’s bonus is based on pre-established performance targets, which will include one or more of the following components: (i) earning or earnings per share of Kroger, a unit of Kroger, or designated projects; (ii) total sales, identical sales, or comparable sales of Kroger, a unit of Kroger, or designated projects; (iii) cash flow; (iv) cash flow from operations; (v) operating profit or income; (vi) net income; (vii) operating margin; (viii) net income margin; (ix) return on net assets; (x) economic value added; (xi) return on total assets; (xii) return on common equity; (xiii) return on total capital; (xiv) total shareholder return; (xv) revenue; (xvi) revenue growth; (xvii) earnings before interest, taxes, depreciation and amortization (“EBITDA”); (xviii) EBITDA growth; (xix) funds from operations per share and per share growth; (xx) cash available for distribution; (xxi) cash available for distribution per
43
share and per share growth; (xxii) share price performance on an absolute basis and relative to an index of earnings per share or improvements in Kroger’s attainment of expense levels; (xxiii) reduction in operating costs as a percentage of sales; (xxiv) performance in key categories; and (xxv) implementing or completion of strategic initiatives or critical projects. Initially the performance targets for annual bonuses will include the following components: (i) EBITDA; (ii) identical sales; (iii) achievement of strategic initiatives; and (iv) sales and earnings results of designated capital projects. Initially the performance targets for long-term bonuses will include the following components: (i) performance in four key categories in our strategic plan, and (ii) operating costs as a percentage of sales.
Bonus Amount. The bonus award for any participant is based on the achievement of specified levels of Kroger performance measured against the pre-established criteria. The Committee, in its discretion, may reduce the amount payable to any named executive officer. In no event may any one bonus earned by a participant exceed $5 million. Participants may earn more than one bonus under this Bonus Plan. Bonuses earned under the Bonus Plan will be deemed incorporated by reference into any other filing, absent an express reference thereto.
Accounting Practices
Amendment. The Bonus Plan may be wholly or partially amended or otherwise modified, suspended or terminated at any time or from time to corporate governance.time by the Committee or the Board. To the extent required by Section 162(m) with respect to bonus awards that the Committee determines should qualify as performance-based compensation as described in Section 162(m)(4)(C), no action may modify the performance criteria or bonus potentials after the commencement of the measurement period with respect to which such bonus awards relate.
BOARDRECOMMENDATION
The Board of Directors adopted governance changesbelieves that were within its discretionthe Bonus Plan provides an appropriate balance between salary compensation and for mattersperformance-based compensation. The Committee may approve similar bonus or other payments outside of the Bonus Plan that require the approval of shareholders, the Board has recommended the action described below. By its actions in December, 2005, the Board revised itsGuidelines on Issues of Corporate Governance (which canmay not be found on our website at http://www.thekrogerco.com/documents/GuidelinesIssues.pdf) to require
THEBOARDOFDIRECTORSANDMANAGEMENTRECOMMENDAVOTEFORTHISPROPOSAL.
| NEW PLAN BENEFITS | ||||
| Kroger Cash Bonus Plan | ||||
| Name and Position | ||||
| Dollar value ($) | Number of Units | |||
| All Groups (1) | (1) | (1) | ||
• sales, leases, exchanges, mortgages, pledges, transfers or other dispositions;• issuances of securities or rights to acquire securities;• adoptions of plans of liquidation or dissolution of Kroger; or• reclassifications of securities.Transactions of the types identified above, in conjunction with other strategies, can be used by shareholders to obtain control of a corporation. Elimination of the supermajority provision would make it easier for a shareholder or a group of shareholders to obtain control of Kroger. Shareholder advocacy groups have suggested that supermajority provisions lead to entrenchment of the Board and permit small minorities of shareholders to thwart reforms favored by the majority of shareholders.44
| (a) | (b) | (c) | |
| Plan Category | Number of securities to | Weighted-average | Number of securities |
| be issued upon exercise | exercise price | remaining for future | |
| of outstanding options, | of outstanding | issuance under equity | |
| warrants and rights | options, warrants | compensation plans | |
| and rights | excluding securities | ||
| reflected in column | |||
| (a) | |||
| Equity compensation plans | |||
| approved by security holders | 51,918,179 | $ 20.09 | 17,595,505 |
| Equity compensation plans not | |||
| approved by security holders | — | $— | — |
| Total | 51,918,179 | $ 20.09 | 17,595,505 |
APPROVALOF AMENDMENTTO REGULATIONSTO PROVIDEFOR RULESOF
CONDUCTIN CONNECTIONWITH SHAREHOLDER MEETINGS; MEETINGS
OUTSIDEOF CINCINNATI
(ITEM NO. 3)
45
46
| Fiscal 2005 | Fiscal 2004 | |||||||||||||
|---|---|---|---|---|---|---|---|---|---|---|---|---|---|---|
| Audit Fees | $ | 4,623,476 | $ | 6,052,828 | ||||||||||
| Audit-Related Fees | 53,500 | 247,624 | ||||||||||||
| Tax Fees | — | 264,023 | ||||||||||||
| All Other Fees | — | — | ||||||||||||
| Total | $ | 4,676,976 | $ | 6,564,475 | ||||||||||
| Fiscal 2006 | Fiscal 2005 | ||||
| Audit Fees | $4,463,916 | $4,926,809 | |||
| Audit-Related Fees | 53,429 | 53,500 | |||
| Tax Fees | — | — | |||
| All Other Fees | — | — | |||
| Total | $4,517,345 | $4,980,309 | |||
47
These developments are being reinforced by corporate acceptance of the need to address climate change. A 2004 Conference Board report declared that, “The global economy will become less carbon-intensive over time…The real questions are what the pace of the transition will be and who will be the winners and losers…businesses that ignore the debate over climate change will do so at their competitive advantagesperil.”
There is increasing recognition that climate change will have important impacts on all sectors.According to Institutional Shareholder Services, “…the scope of impact has expanded beyond the industries generally associated with emissions (energy, oil/gas, auto)… climate change has a measurable impact on companies in all industries.”
Analysts at firms such as Goldman Sachs, McKinsey and JPMorgan Chase have publicly recognized the possible financial implications of climate change and have raised concerns about companies that do not adequately disclose them.
A recent article inInside Green Business reviewed a new study that demonstrates that the retail sector accounts for a large percentage of GHG emissions once supply chain and energy inputs are particularlyaccounted for, which could shift some of the burden for reducing GHGs from power generators to retailers.
Other retailers such as Home Depot and Wal-Mart have committed to improving conditions inaddressing climate change and reducing their poultry suppliers’ slaughterhouses;emissions and
SUPPORTING STATEMENT: We believe management has a fiduciary duty to carefully assess and disclose to shareholders all pertinent information on its response to climate change. We believe taking early action to reduce emissions and prepare for standards could provide competitive advantages, while inaction and opposition to climate change mitigation efforts could expose companies to regulatory and litigation risk and reputational damage.
48
Kroger recognizes the important role it plays as a Sustainability Report. A summarygood steward of the report should be providedenvironment. We have numerous “green” initiatives in place to shareholders by December 2006.
| By order of the Board of Directors, | |
| Paul W. Heldman, Secretary |
49
OF
THEKROGERC
____________
SHAREHOLDERS
of the Company owned of record
50
or beneficially by the shareholder along with evidence of ownership thereof, a description of any material interestmaterialinterest the shareholder has in the subject of the business requested to be conducted and any arrangements orarrangementsor understandings between such shareholder and any other person or persons (including their names) in connectioninconnection with the proposal of such business, a representation that the shareholder intends to appear in personinperson at the meeting to bring such matter before the meeting, and such other information regarding the businessthebusiness proposed by such shareholder as would be required to be included in the proxy statement filed pursuantfiledpursuant to the proxy rules of the Securities and Exchange Commission.
BOARD OF DIRECTORS
51
OFFICERS
INDEMNIFICATION OF DIRECTORS, OFFICERS AND EMPLOYEES
| (1) | he is adjudicated or determined not to have been negligent or guilty of misconduct in the performance of his duty to the Company or such other corporation, | ||
| (2) | he is determined to have acted in good faith in what he reasonably believed to be the best interest of the Company or of such other corporation, and | ||
| (3) | in any matter the subject of a criminal action, suit, or proceeding, he is determined to have had no reasonable cause to believe that his conduct was unlawful. | ||
jurisdiction, the determination as to (1) shall be made by the directors of the Company acting at a meeting at which a quorum consisting of directors who are not parties to or threatened with any such action, suit, or proceeding is present. Any director who is a party to or threatened with any such action,
52
suit or proceeding shall not be qualified to vote and, if for this reason a quorum of directors cannot be obtained to vote on such indemnification, no indemnification shall be made except in accordance with the procedure set forth in paragraph B of this Article IV.
CERTIFICATES FOR SECURITIES
SEAL
AMENDMENTS
53
59_______
2006 A
NNUAL REPORT
David B. Dillon | J. Michael Schlotman | |||||
| Chairman of the Board and | Senior Vice President and | |||||
| Chief Executive Officer | Chief Financial Officer | |||||
| Fiscal Years Ended | |||||||||||||||||||||||
|---|---|---|---|---|---|---|---|---|---|---|---|---|---|---|---|---|---|---|---|---|---|---|---|
| January 28, 2006 (52 weeks) | January 29, 2005 (52 weeks) | January 31, 2004 (52 weeks) | February 1, 2003 (52 weeks) | February 2, 2002 (52 weeks) | |||||||||||||||||||
| (In millions, except per share amounts) | |||||||||||||||||||||||
| Sales | $ | 60,553 | $ | 56,434 | $ | 53,791 | $ | 51,760 | $ | 50,098 | |||||||||||||
| Earnings (loss) before cumulative effect of accounting change | 958 | (104 | ) | 285 | 1,218 | 1,040 | |||||||||||||||||
| Cumulative effect of accounting change (1) | — | — | — | (16 | ) | — | |||||||||||||||||
| Net earnings (loss) | 958 | (104 | ) | 285 | 1,202 | 1,040 | |||||||||||||||||
| Diluted earnings (loss) per share: | |||||||||||||||||||||||
| Earnings (loss) before cumulative effect of accounting change | 1.31 | (0.14 | ) | 0.38 | 1.54 | 1.26 | |||||||||||||||||
| Cumulative effect of accounting change (1) | — | — | — | (.02 | ) | — | |||||||||||||||||
| Net earnings (loss) | 1.31 | (0.14 | ) | 0.38 | 1.52 | 1.26 | |||||||||||||||||
| Total assets | 20,482 | 20,491 | 20,767 | 20,349 | 19,100 | ||||||||||||||||||
| Long-term liabilities, including obligations under capital leases and financing obligations | 9,377 | 10,537 | 10,515 | 10,569 | 10,005 | ||||||||||||||||||
| Shareowners’ equity | 4,390 | 3,619 | 4,068 | 3,937 | 3,592 | ||||||||||||||||||
| Cash dividends per common share(2) | — | — | — | — | — | ||||||||||||||||||
| SELECTEDFINANCIALDATA | ||||||||||||||||
| Fiscal Years Ended | ||||||||||||||||
| February 3, | January 28, | January 29, | January 31, | February 1, | ||||||||||||
| 2007 | 2006 | 2005 | 2004 | 2003 | ||||||||||||
| (53 weeks) | (52 weeks) | (52 weeks) | (52 weeks) | (52 weeks) | ||||||||||||
| (In millions, except per share amounts) | ||||||||||||||||
| Sales | $ | 66,111 | $ | 60,553 | $ | 56,434 | $ | 53,791 | $ | 51,760 | ||||||
| Earnings (loss) before cumulative effect of | ||||||||||||||||
| accounting change | 1,115 | 958 | (104 | ) | 285 | 1,218 | ||||||||||
| Cumulative effect of accounting change (1) | — | — | — | — | (16 | ) | ||||||||||
| Net earnings (loss) | 1,115 | 958 | (104 | ) | 285 | 1,202 | ||||||||||
| Diluted earnings (loss) per share: | ||||||||||||||||
| Earnings (loss) before cumulative effect of | ||||||||||||||||
| accounting change | 1.54 | 1.31 | (0.14 | ) | 0.38 | 1.54 | ||||||||||
| Cumulative effect of accounting change (1) | — | — | — | — | (0.02 | ) | ||||||||||
| Net earnings (loss) | 1.54 | 1.31 | (0.14 | ) | 0.38 | 1.52 | ||||||||||
| Total assets | 21,215 | 20,482 | 20,491 | 20,767 | 20,349 | |||||||||||
| Long-term liabilities, including obligations | ||||||||||||||||
| under capital leases and financing | ||||||||||||||||
| obligations | 8,711 | 9,377 | 10,537 | 10,515 | 10,569 | |||||||||||
| Shareowners’ equity | 4,923 | 4,390 | 3,619 | 4,068 | 3,937 | |||||||||||
| Cash dividends per common share (2) | 0.195 | — | — | — | — | |||||||||||
| (1) | Amounts are net of tax. |
| (2) | During the fiscal year ended February 2, 2002, the Company was prohibited from paying cash dividends under the terms of its previous Credit Agreement. On May 22, 2002, the Company entered into a new Credit Agreement, at which time the restriction on payment of cash dividends was eliminated. |
| COMMONSTOCKPRICERANGE | |||||||||||||
| 2006 | 2005 | ||||||||||||
| Quarter | High | Low | High | Low | |||||||||
| 1st | $ | 20.98 | $ | 18.05 | $ | 18.22 | $ | 15.15 | |||||
| 2nd | $ | 23.23 | $ | 19.37 | $ | 20.00 | $ | 16.46 | |||||
| 3rd | $ | 24.15 | $ | 21.49 | $ | 20.88 | $ | 19.09 | |||||
| 4th | $ | 25.96 | $ | 21.12 | $ | 20.58 | $ | 18.42 | |||||
| 2005 | 2004 | ||||||||||||||||||
|---|---|---|---|---|---|---|---|---|---|---|---|---|---|---|---|---|---|---|---|
| Quarter | | High | | Low | | High | | Low | |||||||||||
| 1st | $ | 18.22 | $ | 15.15 | $ | 19.67 | $ | 15.95 | |||||||||||
| 2nd | $ | 20.00 | $ | 16.46 | $ | 18.36 | $ | 14.70 | |||||||||||
| 3rd | $ | 20.88 | $ | 19.09 | $ | 17.31 | $ | 14.65 | |||||||||||
| 4th | $ | 20.58 | $ | 18.42 | $ | 17.75 | $ | 15.53 | |||||||||||
| Main trading market: New York Stock Exchange (Symbol KR) | |||
| Number of shareholders of record at year-end | |||
| Number of shareholders of record at March | |||
| Determined by number | |||
A-2
The Company hasdid not paidpay dividends on its Common Stock forduring fiscal year 2005. During fiscal 2006, the pastCompany’s Board of Directors adopted a dividend policy and paid three fiscal years.quarterly dividends of $0.065 per share. On March 7, 2006,1, 2007, the Company paid its fourth quarterly dividend of $0.065 per share. On March 15, 2007, the Company announced that its Board of Directors had adopted a dividend policy and declaredincreased the payment of a quarterly dividend of $0.065to $0.075 per share, payable on June 1, 2007, to shareholders of record at the close of business on May 15, 2006, to be paid on June 1, 2006.
QUITY C
| (a) | (b) | (c) | |||||
| Plan Category | Number of securities | Weighted-average | Number of securities | ||||
| to be issued upon | exercise price of | remaining for future | |||||
| exercise of | outstanding options, | issuance under equity | |||||
| outstanding options, | warrants and rights | compensation plans | |||||
| warrants and rights | excluding securities | ||||||
| reflected in column (a) | |||||||
| Equity compensation plans approved by | |||||||
| security holders | 51,918,179 | $ | 20.09 | 17,595,505 | |||
| Equity compensation plans not approved by | |||||||
| security holders | — | $ | — | — | |||
| Total | 51,918,179 | $ | 20.09 | 17,595,505 | |||
A-3
PERFORMANCE GRAPH
Set forth below is a line graph comparing the five-year cumulative total shareholder return on Kroger’s common stock, option plans.
Historically, our peer group has consisted of the major food store companies. In recent years there have been significant changes in the industry, including consolidation and increased competition from supercenters and drug chains. As a result, in 2003 we changed our peer group ( the “Peer Group”) to include companies operating supermarkets, supercenters and warehouse clubs in the United States as well as the major drug chains with which Kroger competes.
COMPARISON OF FIVE-YEAR CUMULATIVE TOTAL RETURN*
OF THE KROGER CO., S&P 500 AND PEER GROUP**
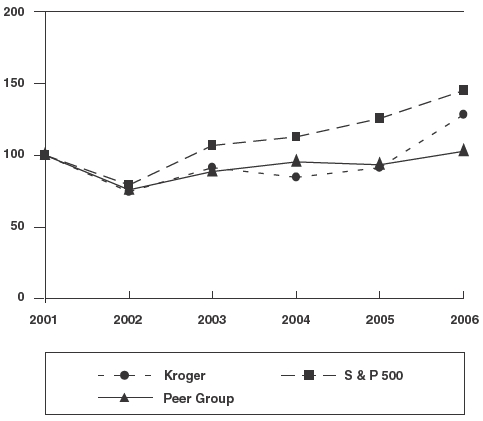
| Base | INDEXED RETURNS | ||||||||||
| Period | Years Ending | ||||||||||
| Company Name/Index | 2001 | 2002 | 2003 | 2004 | 2005 | 2006 | |||||
| The Kroger Co. | 100 | 74.23 | 91.15 | 84.80 | 91.34 | 128.31 | |||||
| S&P 500 Index | 100 | 79.50 | 106.98 | 112.69 | 125.80 | 144.66 | |||||
| Peer Group | 100 | 76.05 | 88.72 | 94.99 | 93.12 | 102.54 | |||||
Kroger’s fiscal year ends on the Saturday closest to January 31.
A-4
____________________
| * | Total assumes $100 invested on February 3, 2002, in The Kroger Co., S&P 500 Index and the Peer Group, with reinvestment of dividends. | |
| ** | The Peer Group consists of Albertson’s, Inc., Costco Wholesale Corp., CVS Corp, Delhaize Group SA (ADR), Great Atlantic & Pacific Tea Company, Inc., Koninklijke Ahold NV (ADR), Marsh Supermarkets Inc. (Class A), Safeway, Inc., Supervalu Inc., Target Corp., Wal-Mart Stores Inc., Walgreen Co., Whole Foods Market Inc. and Winn-Dixie Stores, Inc. Albertson’s, Inc., was substantially acquired by Supervalu in July 2006, and is included through 2005. Marsh Supermarkets was acquired by Marsh Supermarkets Holding Corp. in September 2006, and is included through 2005. Winn-Dixie Stores emerged from bankruptcy in 2006 as a new issue and returns for the old and new issue were calculated then weighted to determine 2006 return. | |
Data supplied by Standard & Poor’s. |
The foregoing Performance Graph will not be deemed incorporated by reference into any other filing, absent an express reference thereto.
A-5
| (a) | (b) | (c) | ||||||||||||
|---|---|---|---|---|---|---|---|---|---|---|---|---|---|---|
| Plan Category | Number of securities to be issued upon exercise of outstanding options, warrants and rights | Weighted-average exercise price of outstanding options, warrants and rights | Number of securities remaining for future issuance under equity compensation plans excluding securities reflected in column (a) | |||||||||||
| Equity compensation plans approved by security holders | 62,684,409 | (1) | $ | 18.6498 | 21,981,686 | |||||||||
| Equity compensation plans not approved by security holders | — | $ | — | — | ||||||||||
| Total | 62,684,409 | (1) | $ | 18.6498 | 21,981,686 | |||||||||
| ISSUERPURCHASESOFEQUITYSECURITIES | ||||||||||
| Maximum | ||||||||||
| Total Number | Dollar | |||||||||
| of Shares | Value of Shares | |||||||||
| Purchased as | that May Yet Be | |||||||||
| Part of | Purchased | |||||||||
| Total | Publicly | Under | ||||||||
| Number | Average | Announced | the Plans or | |||||||
| of Shares | Price Paid | Plans or | Programs (3) | |||||||
| Period (1) | Purchased | Per Share | Programs (2) | (in millions) | ||||||
| First period - four weeks | ||||||||||
| November 5, 2006 to December 2, 2006 | 1,176,497 | $ 21.99 | 1,175,000 | $ 297 | ||||||
| Second period - four weeks | ||||||||||
| December 3, 2006 to December 30, 2006 | 1,203,899 | $ 23.18 | 1,200,000 | $ 271 | ||||||
| Third period - five weeks | ||||||||||
| December 31, 2006 to February 3, 2007 | 2,205,944 | $ 23.75 | 2,200,000 | $ 233 | ||||||
| Total | 4,586,340 | $ 23.15 | 4,575,000 | $ 233 | ||||||
| (1) |
| Period(1) | Total Number of Shares Purchased | Average Price Paid Per Share | Total Number of Shares Purchased as Part of Publicly Announced Plans or Programs(2) | Maximum Dollar Value of Shares that May Yet Be Purchased Under the Plans or Programs (3) (in millions) | ||||||||||||||
|---|---|---|---|---|---|---|---|---|---|---|---|---|---|---|---|---|---|---|
| First four weeks November 6, 2005 to December 3, 2005 | 191,497 | $ | 19.42 | 190,000 | $ | 154 | ||||||||||||
| Second four weeks December 4, 2005 to December 31, 2005 | 670,000 | $ | 19.07 | 370,000 | $ | 147 | ||||||||||||
| Third four weeks January 1, 2006 to January 28, 2006 | 1,978,628 | $ | 18.88 | 1,750,000 | $ | 114 | ||||||||||||
| Total | 2,840,125 | $ | 18.97 | 2,310,000 | $ | 114 | ||||||||||||
| The reported periods conform to the Company’s fiscal calendar composed of thirteen 28-day periods. The fourth quarter of |
| (2) | Shares were repurchased under (i) a $500 million stock repurchase program, authorized by the Board of Directors on |
| (3) | Amounts shown in this column reflect amounts remaining under the $500 million stock repurchase program referenced in Note 2 above. Amounts to be invested under the program utilizing option exercise proceeds are dependent upon option exercise activity. |
A-6
A-9
outstanding. In addition, fiscal 2006 included a 53rd week that benefited the year by an estimated $0.07 per diluted share, excludingadjustments to certain deferred tax balances that benefited the effectyear by $0.03 per diluted share, expense totaling $0.03 per diluted share for increases in legal reserves, and $0.06 per diluted share of goodwill impairment charges, in 2004. We were not only able to leverage sales improvements to achieve earnings growth, but also offset investments in targeted retail
UTURE E
A-10
repurchased 29 million shares of Kroger stock for a total investment of $633 million. During fiscal 2005, we repurchased 15 million shares of Krogerour stock for a total investment of $252 million. During fiscal 2004, we repurchased 20 million shares of our stock
| Total Sales | ||||||||||||||
| (in millions) | ||||||||||||||
| Percentage | Percentage | |||||||||||||
| 2006 | Increase | 2005 | Increase | 2004 | ||||||||||
| Total food store sales without fuel | $ | 57,712 | 7.9 | % | $ | 53,472 | 4.6 | % | $ | 51,106 | ||||
| Total food store fuel sales | 4,455 | 26.3 | % | 3,526 | 53.0 | % | 2,305 | |||||||
| Total food store sales | $ | 62,167 | 9.1 | % | $ | 56,998 | 6.7 | % | $ | 53,411 | ||||
| Other sales (1) | 3,944 | 10.9 | % | 3,555 | 17.6 | % | 3,023 | |||||||
| Total Sales | $ | 66,111 | 9.2 | % | $ | 60,553 | 7.3 | % | $ | 56,434 | ||||
| (1) | Other sales primarily relate to sales at convenience stores, including fuel, jewelry stores and sales by our manufacturing plants to outside firms. |
| 2005 | Percentage Increase | 2004 | Percentage Increase | 2003 | ||||||||||||||||||
|---|---|---|---|---|---|---|---|---|---|---|---|---|---|---|---|---|---|---|---|---|---|---|
| Total food store sales without fuel | $ | 53,472 | 4.6 | % | $ | 51,106 | 2.9 | % | $ | 49,650 | ||||||||||||
| Total food store fuel sales | 3,526 | 53.0 | % | 2,305 | 59.0 | % | 1,450 | |||||||||||||||
| Total food store sales | $ | 56,998 | 6.7 | % | $ | 53,411 | 4.5 | % | $ | 51,100 | ||||||||||||
| Other sales | 3,555 | 17.6 | % | 3,023 | 12.3 | % | 2,691 | |||||||||||||||
| Total Sales | $ | 60,553 | 7.3 | % | $ | 56,434 | 4.9 | % | $ | 53,791 | ||||||||||||
| Identical Supermarket Sales | ||||||
| (in millions) | ||||||
| 2006 | 2005 | |||||
| Including supermarket fuel centers | $ | 59,592 | $ | 55,993 | ||
| Excluding supermarket fuel centers | $ | 55,399 | $ | 52,483 | ||
| Including supermarket fuel centers | 6.4 | % | 5.3 | % | ||
| Excluding supermarket fuel centers | 5.6 | % | 3.5 | % | ||
| 2005 | 2004 | |||||||||
|---|---|---|---|---|---|---|---|---|---|---|
| Including fuel centers | $ | 54,144 | $ | 51,413 | ||||||
| Excluding fuel centers | $ | 50,866 | $ | 49,154 | ||||||
| Including fuel centers | 5.3 | % | 2.1 | % | ||||||
| Excluding fuel centers | 3.5 | % | 0.8 | % | ||||||
| 2005 | 2004 | |||||||||
|---|---|---|---|---|---|---|---|---|---|---|
| Including supermarket fuel centers | $ | 55,607 | $ | 52,514 | ||||||
| Excluding supermarket fuel centers | $ | 52,200 | $ | 50,226 | ||||||
| Including supermarket fuel centers | 5.9 | % | 2.6 | % | ||||||
| Excluding supermarket fuel centers | 3.9 | % | 1.3 | % | ||||||
| Comparable Supermarket Sales | ||||||
| (in millions) | ||||||
| 2006 | 2005 | |||||
| Including supermarket fuel centers | $ | 61,045 | $ | 57,203 | ||
| Excluding supermarket fuel centers | $ | 56,702 | $ | 53,622 | ||
| Including supermarket fuel centers | 6.7 | % | 5.9 | % | ||
| Excluding supermarket fuel centers | 5.7 | % | 3.9 | % | ||
Our FIFO gross margin rates were 24.80%24.27%, 24.80% and 25.38% in 2006, 2005 and 26.38% in 2005, 2004, and 2003, respectively. Excluding the effect of retail fuel operations, our FIFO gross margin rates were 26.69%, 26.73% and 27.31% in 2005, 2004 and 2003, respectively. The growth in our retailRetail fuel sales lowerslowered our FIFO gross margin rate due to the very low FIFO gross margin on retail fuel sales as compared to non-fuel sales. Excluding the effect of retail fuel operations, our FIFO gross margin rates were 26.43%, 26.69% and 26.73% in 2006, 2005 and 2004, respectively. The declining rates ondecrease in our non-fuel sales reflectFIFO gross margin rate reflects our continued investment inreinvestment of operating cost savings into lower retail prices for our customers. In 2005, improvements in shrink, advertising and warehousing costs helped offset higher energy costs and our investments in targeted retail price reductions for our customers. We estimate higher energy costs decreased our FIFO gross margin rate on non-fuel sales by 5 basis points in 2005.
OG&A expenses, as a percent of sales, were 18.21%17.91%, 18.21% and 18.76% in 2006, 2005 and 19.25% in 2005, 2004, and 2003, respectively. Excluding the effect of retail fuel operations, our OG&A rates were 19.68%, 19.81% and 19.98% in 2005, 2004 and 2003, respectively. The growth in our retail fuel sales lowers our OG&A rate due to the very low OG&A rate on retail fuel sales as compared to non-fuel sales. The decliningExcluding the effect of retail fuel operations, our OG&A expenses, as a percent of sales, were 19.59%, 19.68% and 19.81% in 2006, 2005 and 2004, respectively. Excluding the effect of retail fuel operations, expenses recorded for legal reserves and stock option expense, our OG&A rate on non-fuel salesdeclined 28 basis points in 2006. This decrease was primarily the result of our continued recovery in southern California, strongdriven by identical supermarketstore sales growth, by increasing store labor productivity, improvements, lowerand by progress we have made in controlling our health care costs and $12.9 million of settlement income related to a previous class-action credit card lawsuit.costs. These improvements were partially offset by increasedincreases in pension costs,expense and credit card fees and incentive plan expenses, increases in reserves for certain legal matters, the writedown to fair market value of assets held for sale, and the effects of hurricanes Katrina and Rita. We estimate higher energy costs increased our 2005 OG&A rate on non-fuel sales by 7 basis points.
A-12
Depreciation and Amortization Expense
We maintain a trading plan understock repurchase program that complies with Securities Exchange Act Rule 10b5-1 to allow for ourthe orderly repurchase of Krogerour common stock, from time to time, even though we may be aware of material non-public information, as long as purchases are made in accordance with the plan.time. We made open market purchases totaling $374 million, $239 million $291 million and $277$291 million under this repurchase program during fiscal 2006, 2005 2004 and 2003,2004, respectively. In addition to this repurchase program, in December 1999 we began a program to repurchase common stock to reduce dilution resulting from our employee stock option plans. This program is solely funded by proceeds from stock option exercises, including the tax benefit from these exercises. We repurchased approximately $259 million, $13 million $28 million and $24$28 million under the stock option program during 2006, 2005 and 2004, and 2003, respectively.
A-13
Supermarket Storing Activity
| 2006 | 2005 | 2004 | ||||||
| Beginning of year | 2,507 | 2,532 | 2,532 | |||||
| Opened | 20 | 28 | 41 | |||||
| Opened (relocation) | 17 | 12 | 20 | |||||
| Acquired | 1 | 1 | 15 | |||||
| Acquired (relocation) | — | — | 3 | |||||
| Closed (operational) | (60 | ) | (54 | ) | (56 | ) | ||
| Closed (relocation) | (17 | ) | (12 | ) | (23 | ) | ||
| End of year | 2,468 | 2,507 | 2,532 | |||||
| Total food store square footage (in millions) | 142 | 142 | 141 | |||||
CRITICAL ACCOUNTING POLICIES
| 2005 | 2004 | 2003 | ||||||||||||
|---|---|---|---|---|---|---|---|---|---|---|---|---|---|---|
| Beginning of year | 2,532 | 2,532 | 2,488 | |||||||||||
| Opened | 28 | 41 | 44 | |||||||||||
| Opened (relocation) | 12 | 20 | 14 | |||||||||||
| Acquired | 1 | 15 | 25 | |||||||||||
| Acquired (relocation) | — | 3 | 5 | |||||||||||
| Closed (operational) | (54 | ) | (56 | ) | (25 | ) | ||||||||
| Closed (relocation) | (12 | ) | (23 | ) | (19 | ) | ||||||||
| End of year | 2,507 | 2,532 | 2,532 | |||||||||||
| Total food store square footage (in millions) | 142 | 141 | 140 | |||||||||||
A-14
The assumptions underlying the ultimate costs of existing claim losses are subject to a high degree of unpredictability, which can affect the liability recorded for such claims. For example, variability in inflation rates of health care costs inherent in these claims can affect the amounts realized. Similarly, changes in legal trends and interpretations, as well as a change in the nature and method of how claims are settled can affect ultimate costs. Although ourOur estimates of liabilities incurred do not anticipate significant changes in historical trends for these variables, and any changes could have a considerable effect upon future claim costs and currently recorded liabilities.
long-lived assets to be held and used, we compare discounted future cash flows to the asset’s current carrying value. We record impairment when the carrying value exceeds the discounted cash flows. With respect to owned property and equipment held for disposal, we adjust the value of the property and equipment
A-15
The annual impairment review requires the extensive use of accounting judgment and financial estimates. Application of alternative assumptions and definitions, such as reviewing goodwill for impairment at a different organizational level, could produce significantly different results. Similar to our policy on impairment of long-lived assets, the cash flow projections embedded in our goodwill impairment reviews can be affected by several items such as inflation, the economy and market competition.
(a) Company-sponsored Pension Plans
Effective February 3, 2007, we adopted the recognition and disclosure provisions of SFAS No. 158,Employers’ Accounting for Defined Benefit Pension and Other Postretirement Plans-an amendment of FASB Statements No. 87, 99, 106 and 123(R), which required the recognition of the funded status of its retirement plans on the Consolidated Balance Sheet. We are now required to record, as a component of Accumulated Other Comprehensive Income (“AOCI”), actuarial gains or losses, prior service costs or credits and transition obligations that have not yet been recognized.
A-16
| Projected Benefit | ||||||||||||||||||
| Obligation | Expense | |||||||||||||||||
| Point Change | Decrease/(Increase) | Decrease/(Increase) | ||||||||||||||||
| Discount Rate | +/-1.0% | $ | ) | $ | ||||||||||||||
| Expected Return on Assets | +/-1.0% | — | $ | 21/($21) | | |||||||||||||
A-17
In 2005, we updated the mortality table used to determine average life expectancy in the calculation of our pension obligation to the RP-2000 Projected to 2015 mortality table. The change in this assumption increased our projected benefit obligation by approximately $93 million at the time of the change, and is reflected in unrecognized actuarial (gain) loss as of the measurement date.
(b) Multi-Employer Plans
We also contribute to various multi-employer pension plans based on obligations arising from most of our collective bargaining agreements. These plans provide retirement benefits to participants based on their service to contributing employers. The benefits are paid from assets held in trust for that purpose. Trustees are appointed in equal number by employers and unions. The trustees typically are responsible for determining the level of benefits to be provided to participants as well as for such matters as the investment of the assets and the administration of the plans.
A-18
We have made and disclosed this estimate not because this underfunding is a direct liability of Kroger. Rather, we believe the underfunding is likely to have important consequences. We expect our contributions to these multi-employer plans will continue to increase each year, and therefore the expense we recognize under GAAP will increase. In 2005,2006, our contributions to these plans increased approximately 9%4% over the prior year.year and have grown at a compound annual rate of approximately 6% since 2003. We expect our contributions to increase by approximately five percent1.0% in 2006 and each year thereafter.2007. The amount of increases in 20062007 and beyond has been favorably affected by significant improvement in the values of assets held in trusts, by the labor agreements negotiated in southern California and elsewhere during 2005in recent years, and 2004, as well as by related trustee actions. Although underfunding can result in the imposition of excise taxes on contributing employers, increased contributions can reduce underfunding so that excise taxes are not triggered. Our estimate of future contribution increases takes into account the avoidance of those taxes. Finally, underfunding means that, in the event we were to exit certain markets or otherwise cease making contributions to these funds, we could trigger a substantial withdrawal liability. Any adjustment for withdrawal liability will be recorded when it is probable that a liability exists and can be reasonably estimated, in accordance with SFAS No. 87,Employer’sEmployers’ Accounting for PensionsPensions..
we have established an allowance, is audited and fully resolved. As of
A-19
To the extent that we prevail in matters for which allowances have been established, or are required to pay amounts in excess of these allowances, our effective tax rate in any given financial statement period could be materially affected. An unfavorable tax settlement could require use of cash and result in an increase in our effective tax rate in the year of resolution. A favorable tax settlement would be recognized as a reduction in our effective tax rate in the year of resolution.
Prior to the adoption of SFAS No. 123(R), we accounted for share-based payments under Accounting Principles Board (“APB”) Opinion No. 25,Accounting for Stock Issued to Employees and related interpretationsthe disclosure provisions of SFAS No. 123, as amended. We recognized compensation expense for all share-based awards described above using the straight-line attribution method applied to the fair value of each option grant, over the requisite service period associated with each award. The requisite service period is typically consistent with the vesting period, except as noted below. Because awards typically vest evenly over the requisite service period, compensation cost recognized in 2006 is at least equal to the grant-date fair value of the vested portion of all outstanding options.
The weighted-average fair value of stock options granted during 2006, 2005 and 2004 was $6.90, $7.70 and $7.91, respectively. The fair value of each stock option grant was estimated on the date of grant using the Black-Scholes option-pricing model, based on the assumptions shown in the table below. The Black-Scholes model utilizes extensive accounting forjudgment and financial estimates, including the term employees are expected to retain their stock options before exercising them, the volatility of our stock price over that expected term, the dividend yield over the term and the number of awards expected to be forfeited before they vest. Using alternative assumptions in the calculation of fair value would produce fair values for stock option plans. Accordingly, becausegrants that could be different than those used to record share-based compensation expense in the exercise priceConsolidated Statements of Operations.
The following table reflects the weighted-average assumptions used for grants awarded to option holders.
| 2006 | 2005 | 2004 | ||||||
| Weighted average expected volatility | 27.60 | % | 30.83 | % | 30.13 | % | ||
| Weighted average risk-free interest rate | 5.07 | % | 4.11 | % | 3.99 | % | ||
| Expected dividend yield | 1.50 | % | N/A | N/A | ||||
| Expected term | 7.5 years | 8.7 years | 8.7 years | |||||
The weighted-average risk-free interest rate was based on the yield of a treasury note as of the grant date, continuously compounded, which matures at a date that approximates the expected term of the options. Prior to 2006, we did not pay a dividend, so an expected dividend rate was not included in the determination of fair value for options granted during fiscal year 2005. Using a dividend yield of 1.50% to value options issued in 2005 would have decreased the fair value of each option granted equalsby approximately $1.60.
A-20
We determined expected volatility based upon historical stock volatilities. We also considered implied volatility. We determined expected term based upon a combination of historical exercise and cancellation experience, as well as estimates of expected future exercise and cancellation experience.
Under SFAS No. 123(R), we record expense for restricted stock awards in an amount equal to the fair market value of the underlying stock on the option grant date no stock-basedof the award.
In 2006, we recognized total stock compensation expense isof $72 million. This included in net earnings, other than expenses related to$50 million for stock options and $22 million for restricted shares. A total of $18 million of the restricted stock awards. Notes 1 and 12expense was attributable to the wider distribution of restricted shares incorporated into the first quarter 2006 grant of share-based awards (as described in Note 10 to the Consolidated Financial Statements describeStatements), and the effect on net earnings ifremaining $4 million of restricted stock expense related to previously issued restricted stock awards. The incremental compensation cost for all options had been determined based on the fair market value at the grant date for awards, consistent with the methodology prescribed under SFAS No. 123,Accounting for Stock-Based Compensation.
These costs were recognized as operating, general and administrative costs in our Company’s Consolidated Statements of Operations. The cumulative effect of applying a forfeiture rate to unvested restricted shares at January 29, 2006 was not material. The pro forma earnings effect of stock options in prior years, in accordance with SFAS No. 123, is described below:
| (in millions, except per share amounts) | 2005 | 2004 | |||||
| Net earnings (loss), as reported | $ | 958 | $ | (104 | ) | ||
| Stock-based compensation expense included in net earnings, net of | |||||||
| income tax benefits | 5 | 8 | |||||
| Total stock-based compensation expense determined under fair value | |||||||
| method for all awards, net of income tax benefits (1) | (34 | ) | (48 | ) | |||
| Pro forma net earnings (loss) | $ | 929 | $ | (144 | ) | ||
| Earnings (loss) per basic common share, as reported | $ | 1.32 | $ | (0.14 | ) | ||
| Pro forma earnings (loss) per basic common share | $ | 1.28 | $ | (0.20 | ) | ||
| Earnings (loss) per diluted common share, as reported | $ | 1.31 | $ | (0.14 | ) | ||
| Pro forma earnings (loss) per diluted common share | $ | 1.27 | $ | (0.20 | ) | ||
| (1) | Refer to Note 10 of our Consolidated Financial Statements for a summary of the assumptions used for options issued in each year at an option price equal to the fair market value of the stock at the date of the grant. |
As of February 3, 2007, we had $92 million of total unrecognized compensation expense related to non-vested share-based compensation arrangements granted under equity award plans. We expected to recognize this cost over a weighted-average period of approximately one year. The total fair value of options that vested in 2006 was $44 million.
For share-based awards granted prior to the adoption of SFAS No. 123(R), the Company’s stock option grants generally contained retirement-eligibility provisions that caused the options to vest upon the earlier of the stated vesting date or retirement. We calculated compensation expense over the stated vesting periods, regardless of whether certain employees became retirement-eligible during fiscal 2006.
A-21
result, we recognize expense for stock option grants containing such retirement-eligibility provisions over the shorter of the vesting period or the period until employees become retirement-eligible (the requisite service period). As a result of retirement eligibility provisions in stock option awards granted on or after January 29, 2006, we recognized approximately $6 million of compensation expense in 2006 prior to the completion of stated vesting periods.
Inventories
Inventories are stated at the lower of cost (principally on a LIFO basis) or market. In total, approximately 98% of inventories for 20052006 and 2004,2005, respectively, were valued using the LIFO method. Cost for the balance of the inventories was determined using the first-in, first-out (“FIFO”) method. Replacement cost was higher than the carrying amount by $450 million at February 3, 2007, and by $400 million at January 28, 2006, and by $373 million at January 29, 2005.2006. We follow the Link-Chain, Dollar-Value LIFO method for purposes of calculating our LIFO charge or credit.
A-22
$129 million increasedecrease in cash from changes in operating assets and liabilities, compared to a $103$121 million increase and $247a $116 million decrease during 20042005 and 2003,2004, respectively. These amounts are net of cash contributions to our Company-sponsored pension planplans totaling $150 million in 2006, $300 million in 2005 and $35 million in 2004 and $100 million in 2003.
A-23
interest rate environment. However, in the event of a ratings decline, we do not anticipate that access to the CP markets currently available to us would be significantly limited for an extended period of time (i.e., in excess of 30 days). Although our ability to borrow under the credit facilitiesfacility is not affected by our credit rating, the interest cost on borrowings under the credit facilitiesfacility would be affected by a decrease in our credit rating or a decrease in our Applicable Percentage Ratio.
- Our Applicable Percentage Ratio (the ratio of Consolidated EBITDA to Consolidated Total
Interest Expense,InterestExpense, as defined in the creditfacilities)facility) was6.707.50 to 1 as ofJanuary 28, 2006. IfFebruary 3, 2007. Upon furnishing noticeto the lenders, this ratiodeclinedwill entitle us tobelow 4.75 to 1, the cost of our borrowingsa 0.05% reduction in fees under the creditfacilities would increase at least 0.13%. The cost offacility. Althoughour current borrowing rate is determined based on ourborrowingsApplicable Percentage Ratio, underthe credit facilities wouldcertaincircumstances that borrowing rate could besimilarly affecteddetermined bya one-level downgrade inreference to our creditrating.
| 2007 | 2008 | 2009 | 2010 | 2011 | Thereafter | Total | ||||||||||||||||
| Contractual Obligations | ||||||||||||||||||||||
| Long-term debt | $ | 878 | $ | 993 | $ | 912 | $ | 42 | $ | 537 | $3,219 | $ | 6,581 | |||||||||
| Interest on long-term debt (1) | 428 | 332 | 304 | 250 | 222 | 1,712 | 3,248 | |||||||||||||||
| Capital lease obligations | 57 | 54 | 52 | 51 | 49 | 294 | 557 | |||||||||||||||
| Operating lease obligations | 778 | 734 | 690 | 642 | 587 | 4,118 | 7,549 | |||||||||||||||
| Low-income housing obligations | 6 | 2 | — | — | — | — | 8 | |||||||||||||||
| Financed lease obligations | 11 | 11 | 11 | 11 | 11 | 157 | 212 | |||||||||||||||
| Construction commitments | 190 | — | — | — | — | — | 190 | |||||||||||||||
| Purchase obligations | 431 | 56 | 46 | 34 | 23 | 16 | 606 | |||||||||||||||
| Total | $ | 2,779 | $ | 2,182 | $ | 2,015 | $ | 1,030 | $ | 1,429 | $9,516 | $ | 18,951 | |||||||||
| Other Commercial Commitments | ||||||||||||||||||||||
| Credit facility | $ | 352 | $ | — | $ | — | $ | — | $ | — | $ — | $ | 352 | |||||||||
| Standby letters of credit | 331 | — | — | — | — | — | 331 | |||||||||||||||
| Surety bonds | 53 | — | — | — | — | — | 53 | |||||||||||||||
| Guarantees | 6 | — | — | — | — | — | 6 | |||||||||||||||
| Total | $ | 742 | $ | — | $ | — | $ | — | $ | — | $ — | $ | 742 | |||||||||
A-24
| 2006 | 2007 | 2008 | 2009 | 2010 | Thereafter | Total | ||||||||||||||||||||||||
|---|---|---|---|---|---|---|---|---|---|---|---|---|---|---|---|---|---|---|---|---|---|---|---|---|---|---|---|---|---|---|
Contractual Obligations | ||||||||||||||||||||||||||||||
| Long-term debt | $ | 527 | $ | 527 | $ | 1,000 | $ | 912 | $ | 42 | $ | 3,739 | $ | 6,747 | ||||||||||||||||
| Interest on long-term debt (1) | 480 | 423 | 329 | 303 | 250 | 1,922 | 3,707 | |||||||||||||||||||||||
| Capital lease obligations | 61 | 57 | 54 | 52 | 51 | 344 | 619 | |||||||||||||||||||||||
| Operating lease obligations | 784 | 732 | 684 | 635 | 588 | 4,075 | 7,498 | |||||||||||||||||||||||
| Charitable contributions | 14 | — | — | — | — | — | 14 | |||||||||||||||||||||||
| Minimum contributions to Company-sponsored pension plans | — | — | — | — | — | — | — | |||||||||||||||||||||||
| Low-income housing obligations | 47 | 6 | 2 | — | — | — | 55 | |||||||||||||||||||||||
| Financed lease obligations | 11 | 11 | 11 | 11 | 11 | 159 | 214 | |||||||||||||||||||||||
| Construction commitments | 95 | — | — | — | — | — | 95 | |||||||||||||||||||||||
| Purchase obligations | 362 | 60 | 18 | 5 | 1 | — | 446 | |||||||||||||||||||||||
Total | $ | 2,381 | $ | 1,816 | $ | 2,098 | $ | 1,918 | $ | 943 | $ | 10,239 | $ | 19,395 | ||||||||||||||||
Other Commercial Commitments | ||||||||||||||||||||||||||||||
| Credit facilities | $ | — | $ | — | $ | — | $ | — | $ | — | $ | — | $ | — | ||||||||||||||||
| Standby letters of credit | 314 | — | — | — | — | — | 314 | |||||||||||||||||||||||
| Surety bonds | 106 | — | — | — | — | — | 106 | |||||||||||||||||||||||
| Guarantees | 11 | — | — | — | — | — | 11 | |||||||||||||||||||||||
Total | $ | 431 | $ | — | $ | — | $ | — | $ | — | $ | — | $ | 431 | ||||||||||||||||
| (1) | Amounts include contractual interest payments using the interest rate as of |
borrowings under the credit
A-25
We also are contingently liable for leases that have been assigned to various third parties in connection with facility closings and dispositions. We could be required to satisfy obligations under the leases if any of the assignees are unable to fulfill their lease obligations. Due to the wide distribution of our assignments among third parties, and various other remedies available to us, we believe the likelihood that we will be required to assume a material amount of these obligations is remote. We have agreed to indemnify certain third-party logistics operators for certain expenses, including pension trust fund withdrawal liabilities.
| Expected Year of Maturity | |||||||||||||||||||||||||||||||||||
|---|---|---|---|---|---|---|---|---|---|---|---|---|---|---|---|---|---|---|---|---|---|---|---|---|---|---|---|---|---|---|---|---|---|---|---|
| 2006 | 2007 | 2008 | 2009 | 2010 | Thereafter | Total | Fair Value | ||||||||||||||||||||||||||||
| (In millions) | |||||||||||||||||||||||||||||||||||
Debt | |||||||||||||||||||||||||||||||||||
| Fixed rate | $ | (519 | ) | $ | (526 | ) | $ | (994 | ) | $ | (896 | ) | $ | (35 | ) | $ | (3,639 | ) | $ | (6,609 | ) | $ | (6,900 | ) | |||||||||||
| Average interest rate | 7.78 | % | 7.78 | % | 7.27 | % | 7.76 | % | 8.98 | % | 6.66 | % | |||||||||||||||||||||||
| Variable rate | $ | (8 | ) | $ | (1 | ) | $ | (6 | ) | $ | (16 | ) | $ | (7 | ) | $ | (100 | ) | $ | (138 | ) | $ | (138 | ) | |||||||||||
| Average interest rate | 3.29 | % | 3.32 | % | 3.33 | % | 3.38 | % | 3.42 | % | 3.80 | % | |||||||||||||||||||||||
| Average Notional Amounts Outstanding | |||||||||||||||||||||||||||||||||||
|---|---|---|---|---|---|---|---|---|---|---|---|---|---|---|---|---|---|---|---|---|---|---|---|---|---|---|---|---|---|---|---|---|---|---|---|
| 2006 | 2007 | 2008 | 2009 | 2010 | Thereafter | Total | Fair Value | ||||||||||||||||||||||||||||
| (In millions) | |||||||||||||||||||||||||||||||||||
Interest Rate Derivatives | |||||||||||||||||||||||||||||||||||
| Variable to fixed | $ | — | $ | — | $ | — | $ | — | $ | — | $ | — | $ | — | $ | — | |||||||||||||||||||
| Average pay rate | |||||||||||||||||||||||||||||||||||
| Average receive rate | |||||||||||||||||||||||||||||||||||
| Fixed to variable | $ | 1,238 | $ | 1,050 | $ | 363 | $ | 300 | $ | 300 | $ | 300 | $ | 1,375 | $ | (34 | ) | ||||||||||||||||||
| Average pay rate | 8.02 | % | 7.78 | % | 5.71 | % | 5.16 | % | 5.23 | % | 5.26 | % | |||||||||||||||||||||||
| Average receive rate | 6.90 | % | 6.74 | % | 5.38 | % | 4.95 | % | 4.95 | % | 4.95 | % | |||||||||||||||||||||||
RECENTLY ISSUED ACCOUNTING STANDARDS
In June 2006, the FASB issued Interpretation (“FIN”) No. 48,Accounting for Uncertainty in Income Taxes-an interpretation of FASB Statement No. 109. FIN No. 48 prescribes a recognition threshold and measurement attribute for the financial statement recognition and measurement of a tax position taken or expected to be taken in a tax return. This Interpretation also provides guidance on derecognition, classification, interest and penalties, accounting in interim periods, disclosure and transition. FIN No. 48 becomes effective for our fiscal year beginning February 4, 2007. We are evaluating the effect the implementation of FIN No. 48 will have on our Consolidated Financial Statements.
A-26
In September 2006, the FASB issued SFAS No. 157,Fair Value Measurement. SFAS No. 157 defines fair value, establishes a framework for measuring fair value in GAAP and expands disclosures about fair value measurement. SFAS No. 157 does not require any new fair value measurements. SFAS No. 157 will become effective for our fiscal year beginning February 3, 2008. We are evaluating the effect the implementation of SFAS No. 157 will have on our Consolidated Financial Statements.
In February 2007, the FASB issued SFAS No. 159,The Fair Value Option for Financial Assets and Financial Liabilities-Including an amendment of FASB Statement No. 115. SFAS No. 159 permits entities to make an irrevocable election to measure certain financial instruments and other assets and liabilities at fair value on an instrument-by-instrument basis. Unrealized gains and losses on items for which the fair value option has been elected should be recognized into net earnings at each subsequent reporting date. SFAS No. 159 will be become effective for our fiscal year beginning February 3, 2008. We are currently evaluating the effect the adoption of SFAS No. 151159 will have on our Consolidated Financial Statements.
In June 2006, the FASB ratified the consensus of Emerging Issues Task Force (“EITF”) issue No. 06-03,How Taxes Get Collected from Customers and Remitted to Governmental Authorities Should Be Presented in the Income Statement (That Is, Gross versus Net Presentation). EITF No. 06-03 indicates that the income statement presentation of taxes within the scope of the Issue on either a gross basis or a net basis is an accounting policy decision that should be disclosed pursuant to Opinion 22. EITF No. 06-03 becomes effective for our fiscal year beginning February 4, 2007. We do not expectedexpect the adoption of EITF No. 06-03 to have a material effect on our Consolidated Financial Statements.
- We expect earnings per share in the range of $1.60-$1.65 for 2007. This represents earnings pershare growth of approximately
6% - 8%9%-12% in2006. This includes2007, net of the effect of a53rd53rdweek in fiscal 2006which will be substantially offset by the expensingofstock options. We anticipate the expensing of stock options will reduce net earningsapproximately$0.05 - $0.06$0.07 per diluted share. - We
also expect 2007anticipate earnings per share growthtorates in the 1stand 4thquarters of 2007 will beapproximately 6% - 8%, based on comparable 52-week results for 2006.
A-27
- In fiscal
2006,2007, we will continue to focus on driving sales growth and balancing investments ingross margingrossmargin and improved customer service with operating cost reductions to provide a better shoppingexperience for our customers. We expect operating marginsin southern Californiato improve slightlydue to the continued recoveryinthat market, although we expect improvement in 2006 will be less than in 2005. We expect operating margins, excluding the effect of fuel sales, to hold steady in the balance of the Company.
A-28
- We have various labor agreements expiring in
2006,2007, coveringsmaller groups ofassociatesthan those contracts negotiatedin2005.southern California,Cincinnati, Detroit, Houston, Memphis, Toledo, Seattle and West Virginia. We are currently operatingunder a contract extension in southern California. In all of these contracts, rising health careand pensionandpension costs will continue to be an important issue in negotiations. Third parties who operate adistribution facility for us in Louisville, Kentucky, are operating without a labor agreement, and theunion representing employees there may call a strike if an agreement is not reached. A prolonged workstoppageataffecting a substantial number ofstoreslocations could have a material effect on our results.
A-29
- The grocery retail industry continues to experience fierce competition from other traditional
food retailers,foodretailers, supercenters, mass merchandisers, club or warehouse stores, drug stores andrestaurants. Ourrestaurants.Our continued success
The Kroger Co.:
Also, in our opinion, management’s assessment, included in Management’s Report on Internal Control Over Financial Reporting appearing on page A-1 of this Annual Report, that the Company maintained effective internal control over financial reporting as of January 28, 2006February 3, 2007 based on criteria established inInternal Control –- Integrated Framework issued by the Committee of Sponsoring Organizations of the Treadway Commission (COSO), is fairly stated, in all material respects, based on those criteria. Furthermore, in our opinion, the Company maintained, in all material respects, effective internal control over financial reporting as of January 28, 2006,February 3, 2007, based on criteria established inInternal Control –- Integrated Framework issued by the COSO. The Company’s management is responsible for maintaining effective internal control over financial reporting and for its assessment of the effectiveness of internal control over financial reporting. Our responsibility is to express opinions on management’s assessment and on the effectiveness of the Company’s internal control over financial reporting based on our audit. We conducted our audit of internal control over financial reporting in accordance with the standards of the Public Company Accounting Oversight Board (United States). Those standards require that we plan and perform the audit to obtain reasonable assurance about whether effective internal control over financial reporting was maintained in all material respects. An audit of internal control over financial reporting includes obtaining an understanding of internal control over financial reporting, evaluating management’s assessment, testing
A-31
and evaluating the design and operating effectiveness of internal control, and performing such other procedures as we consider necessary in the circumstances. We believe that our audit provides a reasonable basis for our opinions.
accordance with generally accepted accounting principles. A company’s internal control over financial reporting includes those policies and procedures that (i) pertain to the maintenance of records that, in reasonable detail, accurately and fairly reflect the transactions and dispositions of the assets of the company; (ii) provide reasonable assurance that transactions are recorded as necessary to permit preparation of financial statements in accordance with generally accepted accounting principles, and that receipts and expenditures of the company are being made only in accordance with authorizations of management and directors of the company; and (iii) provide reasonable assurance regarding prevention or timely detection of unauthorized acquisition, use, or disposition of the company’s assets that could have a material effect on the financial statements.
 |
| Cincinnati, Ohio |
| April 4, 2007 |
A-32![]()
| (In millions) | | January 28, 2006 | | January 29, 2005 | ||||||
|---|---|---|---|---|---|---|---|---|---|---|
ASSETS | ||||||||||
| Current assets | ||||||||||
| Cash and temporary cash investments | $ | 210 | $ | 144 | ||||||
| Deposits In-Transit | 488 | 506 | ||||||||
| Receivables | 680 | 661 | ||||||||
| Receivables – Taxes | 6 | 167 | ||||||||
| FIFO Inventory | 4,886 | 4,729 | ||||||||
| LIFO Credit | (400 | ) | (373 | ) | ||||||
| Prefunded employee benefits | 300 | 300 | ||||||||
| Prepaid and other current assets | 296 | 272 | ||||||||
| Total current assets | 6,466 | 6,406 | ||||||||
| Property, plant and equipment, net | 11,365 | 11,497 | ||||||||
| Goodwill, net | 2,192 | 2.191 | ||||||||
| Other assets | 459 | 397 | ||||||||
| Total Assets | $ | 20,482 | $ | 20,491 | ||||||
LIABILITIES | ||||||||||
| Current liabilities | ||||||||||
| Current portion of long-term debt including obligations under capital leases and financing obligations | $ | 554 | $ | 71 | ||||||
| Accounts payable | 3,550 | 3,598 | ||||||||
| Accrued salaries and wages | 742 | 659 | ||||||||
| Deferred income taxes | 217 | 286 | ||||||||
| Other current liabilities | 1,652 | 1,721 | ||||||||
| Total current liabilities | 6,715 | 6,335 | ||||||||
| Long-term debt including obligations under capital leases and financing obligations | ||||||||||
| Face value long-term debt including obligations under capital leases and financing obligations | 6,651 | 7,830 | ||||||||
| Adjustment to reflect fair value interest rate hedges | 27 | 70 | ||||||||
| Long-term debt including obligations under capital leases and financing obligations | 6,678 | 7,900 | ||||||||
| Deferred income taxes | 843 | 841 | ||||||||
| Other long-term liabilities | 1,856 | 1,796 | ||||||||
| Total Liabilities | 16,092 | 16,872 | ||||||||
| Commitments and Contingencies | ||||||||||
SHAREOWNERS’ EQUITY | ||||||||||
| Preferred stock, $100 par, 5 shares authorized and unissued | — | — | ||||||||
| Common stock, $1 par, 1,000 shares authorized: 927 shares issued in 2005 and 918 shares issued in 2004 | 927 | 918 | ||||||||
| Additional paid-in capital | 2,536 | 2,432 | ||||||||
| Accumulated other comprehensive loss | (243 | ) | (202 | ) | ||||||
| Accumulated earnings | 4,573 | 3,620 | ||||||||
| Common stock in treasury, at cost, 204 shares in 2005 and 190 shares in 2004 | (3,403 | ) | (3,149 | ) | ||||||
| Total Shareowners’ Equity | 4,390 | 3,619 | ||||||||
| Total Liabilities and Shareowners’ Equity | $ | 20,482 | $ | 20,491 | ||||||
| THE KROGER CO. | |||||||
| CONSOLIDATEDBALANCESHEETS | |||||||
| February 3, | January 28, | ||||||
| (In millions - except par value) | 2007 | 2006 | |||||
| ASSETS | |||||||
| Current assets | |||||||
| Cash and temporary cash investments | $ | 189 | $ | 210 | |||
| Deposits in-transit | 614 | 488 | |||||
| Receivables | 773 | 680 | |||||
| Receivables - taxes | 5 | 6 | |||||
| FIFO inventory | 5,059 | 4,886 | |||||
| LIFO credit | (450 | ) | (400 | ) | |||
| Prefunded employee benefits | 300 | 300 | |||||
| Prepaid and other current assets | 265 | 296 | |||||
| Total current assets | 6,755 | 6,466 | |||||
| Property, plant and equipment, net | 11,779 | 11,365 | |||||
| Goodwill | 2,192 | 2,192 | |||||
| Other assets | 489 | 459 | |||||
| Total Assets | $ | 21,215 | $ | 20,482 | |||
| LIABILITIES | |||||||
| Current liabilities | |||||||
| Current portion of long-term debt including obligations under capital leases | |||||||
| and financing obligations | $ | 906 | $ | 554 | |||
| Accounts payable | 3,804 | 3,546 | |||||
| Accrued salaries and wages | 796 | 780 | |||||
| Deferred income taxes | 268 | 217 | |||||
| Other current liabilities | 1,807 | 1,618 | |||||
| Total current liabilities | 7,581 | 6,715 | |||||
| Long-term debt including obligations under capital leases and financing | |||||||
| obligations | |||||||
| Face value long-term debt including obligations under capital leases and | |||||||
| financing obligations | 6,136 | 6,651 | |||||
| Adjustment to reflect fair value interest rate hedges | 18 | 27 | |||||
| Long-term debt including obligations under capital leases and financing | |||||||
| obligations | 6,154 | 6,678 | |||||
| Deferred income taxes | 722 | 843 | |||||
| Other long-term liabilities | 1,835 | 1,856 | |||||
| Total Liabilities | 16,292 | 16,092 | |||||
| Commitments and Contingencies (See Note 11) | |||||||
| SHAREOWNERS’ EQUITY | |||||||
| Preferred stock, $100 par, 5 shares authorized and unissued | — | — | |||||
| Common stock, $1 par, 1,000 shares authorized: 937 shares issued in 2006 and | |||||||
| 927 shares issued in 2005 | 937 | 927 | |||||
| Additional paid-in capital | 2,755 | 2,536 | |||||
| Accumulated other comprehensive loss | (259 | ) | (243 | ) | |||
| Accumulated earnings | 5,501 | 4,573 | |||||
| Common stock in treasury, at cost, 232 shares in 2006 and 204 shares in 2005 | (4,011 | ) | (3,403 | ) | |||
| Total Shareowners’ Equity | 4,923 | 4,390 | |||||
| Total Liabilities and Shareowners’ Equity | $ | 21,215 | $ | 20,482 | |||
| (In millions, except per share amounts) | | 2005 (52 weeks) | | 2004 (52 weeks) | | 2003 (52 weeks) | ||||||||
|---|---|---|---|---|---|---|---|---|---|---|---|---|---|---|
| Sales | $ | 60,553 | $ | 56,434 | $ | 53,791 | ||||||||
| Merchandise costs, including advertising, warehousing, and transportation, excluding items shown separately below | 45,565 | 42,140 | 39,637 | |||||||||||
| Operating, general and administrative | 11,027 | 10,611 | 10,354 | |||||||||||
| Rent | 661 | 680 | 657 | |||||||||||
| Depreciation and amortization | 1,265 | 1,256 | 1,209 | |||||||||||
| Goodwill impairment charge | — | 904 | 471 | |||||||||||
| Asset impairment charges | — | — | 120 | |||||||||||
| Operating Profit | 2,035 | 843 | 1,343 | |||||||||||
| Interest expense | 510 | 557 | 604 | |||||||||||
| Earnings before income tax expense | 1,525 | 286 | 739 | |||||||||||
| Income tax expense | 567 | 390 | 454 | |||||||||||
| Net earnings (loss) | $ | 958 | $ | (104 | ) | $ | 285 | |||||||
| Net earnings (loss) per basic common share | $ | 1.32 | $ | (0.14 | ) | $ | 0.38 | |||||||
| Average number of common shares used in basic calculation | 724 | 736 | 747 | |||||||||||
| Net earnings (loss) per diluted common share | $ | 1.31 | $ | (0.14 | ) | $ | 0.38 | |||||||
| Average number of common shares used in diluted calculation | 731 | 736 | 754 | |||||||||||
| THE KROGERCO. | ||||||||||
| CONSOLIDATEDSTATEMENTSOFOPERATIONS | ||||||||||
| Years Ended February 3, 2007, January 28, 2006, and January 29, 2005 | ||||||||||
| 2006 | 2005 | 2004 | ||||||||
| (In millions, except per share amounts) | (53 weeks) | (52 weeks) | (52 weeks) | |||||||
| Sales | $66,111 | $60,553 | $56,434 | |||||||
| Merchandise costs, including advertising, warehousing, and | ||||||||||
| transportation, excluding items shown separately below | 50,115 | 45,565 | 42,140 | |||||||
| Operating, general and administrative | 11,839 | 11,027 | 10,611 | |||||||
| Rent | 649 | 661 | 680 | |||||||
| Depreciation and amortization | 1,272 | 1,265 | 1,256 | |||||||
| Goodwill impairment charge | — | — | 904 | |||||||
| Operating Profit | 2,236 | 2,035 | 843 | |||||||
| Interest expense | 488 | 510 | 557 | |||||||
| Earnings before income tax expense | 1,748 | 1,525 | 286 | |||||||
| Income tax expense | 633 | 567 | 390 | |||||||
| Net earnings (loss) | $ 1,115 | $ 958 | $ (104 | ) | ||||||
| Net earnings (loss) per basic common share | $ 1.56 | $ 1.32 | $ (0.14 | ) | ||||||
| Average number of common shares used in basic calculation | 715 | 724 | 736 | |||||||
| Net earnings (loss) per diluted common share | $ 1.54 | $ 1.31 | $ (0.14 | ) | ||||||
| Average number of common shares used in diluted calculation | 723 | 731 | 736 | |||||||
| (In millions) | | 2005 (52 weeks) | | 2004 (52 weeks) | | 2003 (52 weeks) | ||||||||
|---|---|---|---|---|---|---|---|---|---|---|---|---|---|---|
| Cash Flows From Operating Activities: | ||||||||||||||
| Net earnings (loss) | $ | 958 | $ | (104 | ) | $ | 285 | |||||||
| Adjustments to reconcile net earnings (loss) to net cash provided by operating activities: | ||||||||||||||
| Depreciation and amortization | 1,265 | 1,256 | 1,209 | |||||||||||
| LIFO charge | 27 | 49 | 34 | |||||||||||
| Pension expense for Company-sponsored pension plans | 138 | 117 | 92 | |||||||||||
| Goodwill impairment charge | — | 861 | 471 | |||||||||||
| Asset impairment charges | — | — | 120 | |||||||||||
| Deferred income taxes | (63 | ) | 230 | 329 | ||||||||||
| Other | 39 | 59 | 22 | |||||||||||
| Changes in operating assets and liabilities net of effects from acquisitions of businesses: | ||||||||||||||
| Store deposits in-transit | 18 | 73 | (363 | ) | ||||||||||
| Inventories | (157 | ) | (236 | ) | (20 | ) | ||||||||
| Receivables | (19 | ) | 13 | 3 | ||||||||||
| Prepaid expenses | 31 | (31 | 5 | |||||||||||
| Accounts payable | (80 | ) | 167 | 44 | ||||||||||
| Accrued expenses | 162 | (10 | ) | 132 | ||||||||||
| Income taxes receivable (payable) | 200 | (86 | ) | (62 | ) | |||||||||
| Contribution to company sponsored pension plans | (300 | ) | (35 | ) | (100 | ) | ||||||||
| Other | (27 | ) | 7 | 14 | ||||||||||
| Net cash provided by operating activities | 2,192 | 2,330 | 2,215 | |||||||||||
| Cash Flows From Investing Activities: | ||||||||||||||
| Capital expenditures, excluding acquisitions | (1,306 | ) | (1,634 | ) | (2,000 | ) | ||||||||
| Proceeds from sale of assets | 69 | 86 | 68 | |||||||||||
| Payments for acquisitions, net of cash acquired | — | (25 | ) | (87 | ) | |||||||||
| Other | (42 | ) | (35 | ) | (7 | ) | ||||||||
| Net cash used by investing activities | (1,279 | ) | (1,608 | ) | (2,026 | ) | ||||||||
| Cash Flows From Financing Activities: | ||||||||||||||
| Proceeds from issuance of long-term debt | 14 | 616 | 347 | |||||||||||
| Proceeds from lease-financing transactions | 76 | 6 | — | |||||||||||
| Payments on long-term debt | (103 | ) | (701 | ) | (816 | ) | ||||||||
| Borrowings (payments) on bank revolver | (694 | ) | (309 | ) | 329 | |||||||||
| Debt prepayment costs | — | (25 | ) | (17 | ) | |||||||||
| Financing charges incurred | — | (5 | ) | (3 | ) | |||||||||
| Proceeds from issuance of capital stock | 78 | 25 | 39 | |||||||||||
| Treasury stock purchases | (252 | ) | (319 | ) | (301 | ) | ||||||||
| Cash received from interest rate swap terminations | — | — | 114 | |||||||||||
| Increase (decrease) in book overdrafts | 34 | (25 | ) | 107 | ||||||||||
| Net cash used by financing activities | (847 | ) | (737 | ) | (201 | ) | ||||||||
| Net increase (decrease) in cash and temporary cash investments | 66 | (15 | ) | (12 | ) | |||||||||
| Cash and temporary cash investments: | ||||||||||||||
| Beginning of year | 144 | 159 | 171 | |||||||||||
| End of year | $ | 210 | $ | 144 | $ | 159 | ||||||||
| Disclosure of cash flow information: | ||||||||||||||
| Cash paid during the year for interest | $ | 511 | $ | 590 | $ | 589 | ||||||||
| Cash paid during the year for income taxes | $ | 431 | $ | 206 | $ | 139 | ||||||||
| THE KROGERCO. | ||||||||||||
| CONSOLIDATEDSTATEMENTSOFCASHFLOWS | ||||||||||||
| Year Ended February 3, 2007, January 28, 2006 and January 29, 2005 | ||||||||||||
| 2006 | 2005 | 2004 | ||||||||||
| (In millions) | (53 weeks) | (52 weeks) | (52 weeks) | |||||||||
| Cash Flows From Operating Activities: | ||||||||||||
| Net earnings (loss) | $1,115 | $ 958 | $ (104 | ) | ||||||||
| Adjustments to reconcile net earnings (loss) to net cash provided by operating | ||||||||||||
| activities: | ||||||||||||
| Depreciation and amortization | 1,272 | 1,265 | 1,256 | |||||||||
| LIFO charge | 50 | 27 | 49 | |||||||||
| Stock option expense | 72 | 7 | 13 | |||||||||
| Expense for Company-sponsored pension plans | 161 | 138 | 117 | |||||||||
| Goodwill impairment charge | — | — | 861 | |||||||||
| Deferred income taxes | (60 | ) | (63 | ) | 230 | |||||||
| Other | 20 | 39 | 59 | |||||||||
| Changes in operating assets and liabilities net of effects from acquisitions of | ||||||||||||
| businesses: | ||||||||||||
| Store deposits in-transit | (125 | ) | 18 | 73 | ||||||||
| Inventories | (173 | ) | (157 | ) | (236 | ) | ||||||
| Receivables | (90 | ) | (19 | ) | 13 | |||||||
| Prepaid expenses | (43 | ) | 31 | (31 | ) | |||||||
| Accounts payable | 256 | (80 | ) | 167 | ||||||||
| Accrued expenses | 98 | 155 | (23 | ) | ||||||||
| Income taxes receivable (payable) | (4 | ) | 200 | (86 | ) | |||||||
| Contribution to Company-sponsored pension plans | (150 | ) | (300 | ) | (35 | ) | ||||||
| Other | (48 | ) | (27 | ) | 7 | |||||||
| Net cash provided by operating activities | 2,351 | 2,192 | 2,330 | |||||||||
| Cash Flows From Investing Activities: | ||||||||||||
| Capital expenditures, excluding acquisitions | (1,683 | ) | (1,306 | ) | (1,634 | ) | ||||||
| Proceeds from sale of assets | 143 | 69 | 86 | |||||||||
| Payments for acquisitions, net of cash acquired | — | — | (25 | ) | ||||||||
| Other | (47 | ) | (42 | ) | (35 | ) | ||||||
| Net cash used by investing activities | (1,587 | ) | (1,279 | ) | (1,608 | ) | ||||||
| Cash Flows From Financing Activities: | ||||||||||||
| Proceeds from issuance of long-term debt | 10 | 14 | 616 | |||||||||
| Proceeds from lease-financing transactions | 15 | 76 | 6 | |||||||||
| Payments on long-term debt | (556 | ) | (103 | ) | (701 | ) | ||||||
| Borrowings (payments) on bank revolver | 352 | (694 | ) | (309 | ) | |||||||
| Debt prepayment costs | — | — | (25 | ) | ||||||||
| Proceeds from issuance of capital stock | 168 | 78 | 25 | |||||||||
| Treasury stock purchases | (633 | ) | (252 | ) | (319 | ) | ||||||
| Dividends paid | (140 | ) | — | — | ||||||||
| Other | (1 | ) | 34 | (30 | ) | |||||||
| Net cash used by financing activities | (785 | ) | (847 | ) | (737 | ) | ||||||
| Net increase (decrease) in cash and temporary cash investments | (21 | ) | 66 | (15 | ) | |||||||
| Cash and temporary cash investments: | ||||||||||||
| Beginning of year | 210 | 144 | 159 | |||||||||
| End of year | $ 189 | $ 210 | $ 144 | |||||||||
| Reconciliation of capital expenditures | ||||||||||||
| Payments for property and equipment | $(1,683 | ) | $(1,306 | ) | $(1,634 | ) | ||||||
| Changes in construction-in-progress payables | (94 | ) | — | — | ||||||||
| Total capital expenditures | $(1,777 | ) | $(1,306 | ) | $(1,634 | ) | ||||||
| Disclosure of cash flow information: | ||||||||||||
| Cash paid during the year for interest | $ 514 | $ 511 | $ 590 | |||||||||
| Cash paid during the year for income taxes | $ 615 | $ 431 | $ 206 | |||||||||
| THEKROGERCO. | THEKROGERCO. | |||||||||||||||||||||||||||||||||||||||||||||||||||||||||||||
| CONSOLIDATEDSTATEMENTOFCHANGESINSHAREOWNERS’EQUITY | CONSOLIDATEDSTATEMENTOFCHANGESINSHAREOWNERS’EQUITY | |||||||||||||||||||||||||||||||||||||||||||||||||||||||||||||
| Year Ended February 3, 2007, January 28, 2006 and January 29, 2005 | Year Ended February 3, 2007, January 28, 2006 and January 29, 2005 | |||||||||||||||||||||||||||||||||||||||||||||||||||||||||||||
| Accumulated | ||||||||||||||||||||||||||||||||||||||||||||||||||||||||||||||
| Additional | Other | |||||||||||||||||||||||||||||||||||||||||||||||||||||||||||||
| Common Stock | Treasury Stock | Common Stock | Paid-In | TreasuryStock | Comprehensive | Accumulated | ||||||||||||||||||||||||||||||||||||||||||||||||||||||||
|---|---|---|---|---|---|---|---|---|---|---|---|---|---|---|---|---|---|---|---|---|---|---|---|---|---|---|---|---|---|---|---|---|---|---|---|---|---|---|---|---|---|---|---|---|---|---|---|---|---|---|---|---|---|---|---|---|---|---|---|---|---|---|
| (In millions) | Shares | | Amount | | Additional Paid-In Capital | | Shares | | Amount | | Accumulated Other Comprehensive Gain (Loss) | | Accumulated Earnings | | Total | Shares | Amount | Capital | Shares | Amount | Gain (Loss) | Earnings | Total | |||||||||||||||||||||||||||||||||||||||
| Balances at February 1, 2003 | 908 | $ | 908 | $ | 2,317 | 150 | $ | (2,521 | ) | $ | (206 | ) | $ | 3,439 | $ | 3,937 | ||||||||||||||||||||||||||||||||||||||||||||||
| Issuance of common stock: | ||||||||||||||||||||||||||||||||||||||||||||||||||||||||||||||
| Stock options and warrants exercised | 4 | 4 | 35 | — | — | — | — | 39 | ||||||||||||||||||||||||||||||||||||||||||||||||||||||
| Restricted stock issued | 1 | 1 | 9 | — | — | — | — | 10 | ||||||||||||||||||||||||||||||||||||||||||||||||||||||
| Treasury stock activity: | ||||||||||||||||||||||||||||||||||||||||||||||||||||||||||||||
| Treasury stock purchases, at cost | — | — | — | 19 | (301 | ) | — | — | (301 | ) | ||||||||||||||||||||||||||||||||||||||||||||||||||||
| Stock options and restricted stock exchanged | — | — | — | 1 | (5 | ) | (5 | ) | ||||||||||||||||||||||||||||||||||||||||||||||||||||||
| Tax benefits from exercise of stock options and warrants | — | — | 21 | — | — | — | — | 21 | ||||||||||||||||||||||||||||||||||||||||||||||||||||||
| Other comprehensive gain, net of income tax of $(49) | — | — | — | — | — | 82 | — | 82 | ||||||||||||||||||||||||||||||||||||||||||||||||||||||
| Net earnings | — | — | — | — | — | — | 285 | 285 | ||||||||||||||||||||||||||||||||||||||||||||||||||||||
| Balances at January 31, 2004 | 913 | 913 | 2,382 | 170 | (2,827 | ) | (124 | ) | 3,724 | 4,068 | 913 | $ 913 | $ 2,382 | 170 | $ (2,827 | ) | $ (124 | ) | $ 3,724 | $4,068 | ||||||||||||||||||||||||||||||||||||||||||
| Issuance of common stock: | ||||||||||||||||||||||||||||||||||||||||||||||||||||||||||||||
| Stock options and warrants exercised | 4 | 4 | 25 | — | — | — | — | 29 | 4 | 4 | 25 | — | — | — | — | 29 | ||||||||||||||||||||||||||||||||||||||||||||||
| Restricted stock issued | 1 | 1 | 9 | — | — | — | — | 10 | 1 | 1 | 9 | — | — | — | — | 10 | ||||||||||||||||||||||||||||||||||||||||||||||
| Treasury stock activity: | �� | |||||||||||||||||||||||||||||||||||||||||||||||||||||||||||||
| Treasury stock purchases, at cost | — | — | — | 18 | (294 | ) | — | — | (294 | ) | — | — | — | 18 | (294 | ) | — | — | (294 | ) | ||||||||||||||||||||||||||||||||||||||||||
| Stock options and restricted stock exchanged | — | — | — | 2 | (28 | ) | — | — | (28 | ) | — | — | — | 2 | (28 | ) | — | — | (28 | ) | ||||||||||||||||||||||||||||||||||||||||||
| Tax benefits from exercise of stock options and warrants | — | — | 16 | — | — | — | — | 16 | ||||||||||||||||||||||||||||||||||||||||||||||||||||||
| Other comprehensive loss net of income tax of $47 | — | — | — | — | — | (78 | ) | — | (78 | ) | ||||||||||||||||||||||||||||||||||||||||||||||||||||
| Tax benefits from exercise of stock options and | ||||||||||||||||||||||||||||||||||||||||||||||||||||||||||||||
| warrants | — | — | 16 | — | — | — | — | 16 | ||||||||||||||||||||||||||||||||||||||||||||||||||||||
| Other comprehensive gain, net of income | ||||||||||||||||||||||||||||||||||||||||||||||||||||||||||||||
| tax of $47 | — | — | — | — | — | (78 | ) | — | (78 | ) | ||||||||||||||||||||||||||||||||||||||||||||||||||||
| Net loss | — | — | — | — | — | — | (104 | ) | (104 | ) | — | — | — | — | — | — | (104 | ) | (104 | ) | ||||||||||||||||||||||||||||||||||||||||||
| Balances at January 29, 2005 | 918 | 918 | 2,432 | 190 | (3,149 | ) | (202 | ) | 3,620 | 3,619 | 918 | 918 | 2,432 | 190 | (3,149 | ) | (202 | ) | 3,620 | 3,619 | ||||||||||||||||||||||||||||||||||||||||||
| Issuance of common stock: | ||||||||||||||||||||||||||||||||||||||||||||||||||||||||||||||
| Stock options and warrants exercised | 8 | 8 | 57 | — | — | — | — | 65 | 8 | 8 | 57 | — | — | — | — | 65 | ||||||||||||||||||||||||||||||||||||||||||||||
| Restricted stock issued | 1 | 1 | 13 | — | — | — | — | 14 | 1 | 1 | 13 | — | — | — | — | 14 | ||||||||||||||||||||||||||||||||||||||||||||||
| Treasury stock activity: | ||||||||||||||||||||||||||||||||||||||||||||||||||||||||||||||
| Treasury stock purchases, at cost | — | — | — | 14 | (239 | ) | — | — | (239 | ) | — | — | — | 14 | (239 | ) | — | — | (239 | ) | ||||||||||||||||||||||||||||||||||||||||||
| Stock options and restricted stock exchanged | — | — | — | — | (15 | ) | — | — | (15 | ) | — | — | — | — | (15 | ) | — | — | (15 | ) | ||||||||||||||||||||||||||||||||||||||||||
| Tax benefits from exercise of stock options and warrants | — | — | 34 | — | — | — | — | 34 | ||||||||||||||||||||||||||||||||||||||||||||||||||||||
| Other comprehensive loss net of income tax of $26 | — | — | — | — | — | (41 | ) | — | (41 | ) | ||||||||||||||||||||||||||||||||||||||||||||||||||||
| Tax benefits from exercise of stock options and | ||||||||||||||||||||||||||||||||||||||||||||||||||||||||||||||
| warrants | — | — | 34 | — | — | — | — | 34 | ||||||||||||||||||||||||||||||||||||||||||||||||||||||
| Other comprehensive loss net of income | ||||||||||||||||||||||||||||||||||||||||||||||||||||||||||||||
| tax of $26 | — | — | — | — | — | (41 | ) | — | (41 | ) | ||||||||||||||||||||||||||||||||||||||||||||||||||||
| Other | (5 | ) | (5 | ) | — | — | — | — | — | — | (5 | ) | (5 | ) | ||||||||||||||||||||||||||||||||||||||||||||||||
| Net earnings | — | — | — | — | — | — | 958 | 958 | — | — | — | — | — | — | 958 | 958 | ||||||||||||||||||||||||||||||||||||||||||||||
| Balances at January 28, 2006 | 927 | $ | 927 | $ | 2,536 | 204 | $ | (3,403 | ) | $ | (243 | ) | $ | 4,573 | $ | 4,390 | 927 | 927 | 2,536 | 204 | (3,403 | ) | (243 | ) | 4,573 | 4,390 | ||||||||||||||||||||||||||||||||||||
| Comprehensive income: | ||||||||||||||||||||||||||||||||||||||||||||||||||||||||||||||
| Issuance of common stock: | ||||||||||||||||||||||||||||||||||||||||||||||||||||||||||||||
| Stock options and warrants exercised | 9 | 9 | 95 | (1 | ) | 30 | — | — | 134 | |||||||||||||||||||||||||||||||||||||||||||||||||||||
| Restricted stock issued | 1 | 1 | 13 | — | (5 | ) | — | — | 9 | |||||||||||||||||||||||||||||||||||||||||||||||||||||
| Treasury stock activity: | ||||||||||||||||||||||||||||||||||||||||||||||||||||||||||||||
| Treasury stock purchases, at cost | — | — | — | 18 | (374 | ) | — | — | (374 | ) | ||||||||||||||||||||||||||||||||||||||||||||||||||||
| Stock options and restricted stock exchanged | — | — | — | 11 | (259 | ) | — | — | (259 | ) | ||||||||||||||||||||||||||||||||||||||||||||||||||||
| Tax benefits from exercise of stock options and | ||||||||||||||||||||||||||||||||||||||||||||||||||||||||||||||
| warrants | — | — | 39 | — | — | — | — | 39 | ||||||||||||||||||||||||||||||||||||||||||||||||||||||
| Share-based employee compensation | — | — | 72 | — | — | — | — | 72 | ||||||||||||||||||||||||||||||||||||||||||||||||||||||
| Other comprehensive gain net of | ||||||||||||||||||||||||||||||||||||||||||||||||||||||||||||||
| income tax of $(63) | — | — | — | — | — | 102 | — | 102 | ||||||||||||||||||||||||||||||||||||||||||||||||||||||
| SFAS No. 158 adjustment net of | ||||||||||||||||||||||||||||||||||||||||||||||||||||||||||||||
| income tax of $71 | — | — | — | — | — | (120 | ) | — | (120 | ) | ||||||||||||||||||||||||||||||||||||||||||||||||||||
| Other | — | — | — | — | — | 2 | — | 2 | ||||||||||||||||||||||||||||||||||||||||||||||||||||||
| Cash dividends declared | ||||||||||||||||||||||||||||||||||||||||||||||||||||||||||||||
| ($0.26 per common share) | — | — | — | — | — | — | (187 | ) | (187 | ) | ||||||||||||||||||||||||||||||||||||||||||||||||||||
| Net earnings | — | — | — | — | — | — | 1,115 | 1,115 | ||||||||||||||||||||||||||||||||||||||||||||||||||||||
| Balances at February 3, 2007 | 937 | $ 937 | $ 2,755 | 232 | $ (4,011 | ) | $ (259 | ) | $ 5,501 | $4,923 | ||||||||||||||||||||||||||||||||||||||||||||||||||||
| 2005 | 2004 | 2003 | 2006 | 2005 | 2004 | |||||||||||||||||||||||||||||||||||||||||||||||||||||||||
| Net earnings (loss) | $ | 958 | $ | (104 | ) | $ | 285 | $1,115 | $958 | $(104 | ) | |||||||||||||||||||||||||||||||||||||||||||||||||||
| Reclassification adjustment for losses included in net earnings (loss), net of income tax of $(14) in 2003 | — | — | 23 | |||||||||||||||||||||||||||||||||||||||||||||||||||||||||||
| Unrealized gain (loss) on hedging activities, net of income tax of $(1) in 2005, $1 in 2004 and $(2) in 2003 | 1 | (1 | ) | 3 | ||||||||||||||||||||||||||||||||||||||||||||||||||||||||||
| Additional minimum pension liability adjustment, net of income tax of $26 in 2005, $46 in 2004 and $(33) in 2003 | (42 | ) | (77 | ) | 56 | |||||||||||||||||||||||||||||||||||||||||||||||||||||||||
| Reclassification adjustment for losses included | ||||||||||||||||||||||||||||||||||||||||||||||||||||||||||||||
| in net earnings (loss) | — | — | — | |||||||||||||||||||||||||||||||||||||||||||||||||||||||||||
| Unrealized gain (loss) on hedging activities, net | ||||||||||||||||||||||||||||||||||||||||||||||||||||||||||||||
| of income tax of $(5) in 2006 $(1) in 2005 | ||||||||||||||||||||||||||||||||||||||||||||||||||||||||||||||
| and $1 in 2004 | 7 | 1 | (1 | ) | ||||||||||||||||||||||||||||||||||||||||||||||||||||||||||
| Additional minimum pension liability | ||||||||||||||||||||||||||||||||||||||||||||||||||||||||||||||
| adjustment, net of income tax of $(58) in | ||||||||||||||||||||||||||||||||||||||||||||||||||||||||||||||
| 2006, $26 in 2005 | ||||||||||||||||||||||||||||||||||||||||||||||||||||||||||||||
| and $46 in 2004 | 95 | (42 | ) | (77 | ) | |||||||||||||||||||||||||||||||||||||||||||||||||||||||||
| Comprehensive income (loss) | $ | 917 | $ | (182 | ) | $ | 367 | $1,217 | $917 | $(182 | ) | |||||||||||||||||||||||||||||||||||||||||||||||||||
Certain prior-year amounts have been reclassified to conform to current year presentation.
The following is a summary of the significant accounting policies followed in preparing these financial statements.
A-37
NOTESTO CONSOLIDATED FINANCIAL STATEMENTS, CONTINUED
The Company evaluates inventory shortages throughout the year based on actual physical counts in its facilities. Allowances for inventory shortages are recorded based on the results of these counts to provide for estimated shortages as of the financial statement date.
A-38
NOTESTO CONSOLIDATED FINANCIAL STATEMENTS, CONTINUED
pharmacy prescription files, respectively. Leasehold equities are amortized over the remaining life of the lease. Owned liquor licenses are not amortized, while liquor licenses that must be renewed are amortized over their useful lives. Pharmacy prescription file purchases are amortized over seven years. These assets are considered annually during the Company’s testing for impairment.
| Future Lease | |||||||||||
| Obligations | |||||||||||
| Balance at January 29, 2005 | $ | 65 | |||||||||
| Additions | 10 | ||||||||||
| Payments | |||||||||||
| ) | |||||||||||
| Adjustments | ) | ||||||||||
| Balance at January 28, 2006 | 65 | ||||||||||
| Additions | |||||||||||
| Payments | (14 | ) | |||||||||
| Adjustments | (27 | ) | |||||||||
| Balance at February 3, 2007 | $ | 33 | |||||||||
Effective February 3, 2007, the Company adopted the provisions of SFAS No. 158,Employers’ Accounting for Defined Benefit Pension and Other Postretirement Plans-an amendment of FASB Statements No. 87, 99, 106 and 123(R), which required the recognition of the funded status of its retirement plans on the Consolidated Balance Sheet. Actuarial gains or losses, prior service costs or credits and transition obligations that have not yet been recognized are now required to be recorded as a component of Accumulated Other Comprehensive Income (“AOCI”).
A-40
NOTESTO CONSOLIDATED FINANCIAL STATEMENTS, CONTINUED
The determination of the obligation and expense for Company-sponsored pension plans and other post-retirement benefits is dependent on the selection of assumptions used by actuaries and the Company in calculating those amounts. Those assumptions are described in Note 1714 and include, among others, the discount rate, the expected long-term rate of return on plan assets and the rates of increase in compensation and health care costs. In accordance with generally accepted accounting principles, actualActual results that differ from the assumptions are accumulated and amortized over future periods and, therefore, generally affect the recognized expense and recorded obligation in future periods. While the Company believes that the assumptions are appropriate, significant differences in actual experience or significant changes in assumptions may materially affect the pension and other post-retirement obligations and future expense.
| | 2005 | | 2004 | | 2003 | |||||||||
|---|---|---|---|---|---|---|---|---|---|---|---|---|---|---|
| Net earnings (loss), as reported | $ | 958 | $ | (104 | ) | $ | 285 | |||||||
| Add: Stock-based compensation expense included in net earnings, net of income tax benefits | 5 | 8 | 8 | |||||||||||
| Subtract: Total stock-based compensation expense determined under fair value method for all awards, net of income tax benefits(1) | (34 | ) | (48 | ) | (48 | ) | ||||||||
| Pro forma net earnings (loss) | $ | 929 | $ | (144 | ) | $ | 245 | |||||||
| Earnings (loss) per basic common share, as reported | $ | 1.32 | $ | (0.14 | ) | $ | 0.38 | |||||||
| Pro forma earnings (loss) per basic common share | $ | 1.28 | $ | (0.20 | ) | $ | 0.33 | |||||||
| Earnings (loss) per diluted common share, as reported | $ | 1.31 | $ | (0.14 | ) | $ | 0.38 | |||||||
| Pro forma earnings (loss) per diluted common share | $ | 1.27 | $ | (0.20 | ) | $ | 0.32 | |||||||
before a particular matter, for which an allowance has been established, is audited and fully resolved. As of
A-41
NOTESTO CONSOLIDATED FINANCIAL STATEMENTS, CONTINUED
The establishment of the Company’s tax contingency allowances relies on the judgment of management to estimate the exposures associated with the Company’s various filing positions.
A-42
NOTESTO CONSOLIDATED FINANCIAL STATEMENTS, CONTINUED
is recognized. When it is not possible, due
to systems constraints, to allocate vendor allowances to the product by item, vendor allowances are recognized as a reduction in merchandise costs based on inventory turns and, therefore, recognized as the product is sold.
| Facility Closure Costs | Incentive Awards and Contributions | |||||||||
|---|---|---|---|---|---|---|---|---|---|---|
| Balance at February 1, 2003 | $ | 74 | $ | 20 | ||||||
| Adjustment of charitable contribution allowance | — | (5 | ) | |||||||
| Payments | (10 | ) | — | |||||||
| Balance at January 31, 2004 | 64 | 15 | ||||||||
| Payments | (7 | ) | (1 | ) | ||||||
| Balance at January 29, 2005 | 57 | 14 | ||||||||
| Payments | (4 | ) | — | |||||||
| Balance at January 28, 2006 | $ | 53 | $ | 14 | ||||||
| Goodwill | |||||||
| Balance at January 31, 2004 | $3,138 | ||||||
| Goodwill impairment charge | ) | ||||||
| Goodwill recorded | 6 | ||||||
| Purchase accounting adjustments | ) | ||||||
| Balance at January 29, 2005 | 2,191 | ||||||
| Goodwill impairment charge | — | ||||||
| Goodwill recorded | — | ||||||
| Purchase accounting adjustments | 1 | ||||||
| Balance at January 28, 2006 | 2,192 | ||||||
| Goodwill impairment charge | — | ||||||
| Goodwill recorded | — | ||||||
| Purchase accounting adjustments | — | ||||||
| Balance at February 3, 2007 | $ | 2,192 | |||||
| 2006 | 2005 | ||||||
| Land | $ | 1,690 | $ | 1,675 | |||
| Buildings and land improvements | 5,402 | 5,142 | |||||
| Equipment | 8,255 | 7,980 | |||||
| Leasehold improvements | 4,221 | 3,917 | |||||
| Construction-in-progress | 822 | 511 | |||||
| Leased property under capital leases and financing obligations | 592 | 561 | |||||
| Total property, plant and equipment | 20,982 | 19,786 | |||||
| Accumulated depreciation and amortization | (9,203 | ) | (8,421 | ) | |||
| Property, plant and equipment, net | $ | 11,779 | $ | 11,365 | |||
| 2005 | 2004 | |||||||||
|---|---|---|---|---|---|---|---|---|---|---|
| Land | $ | 1,675 | $ | 1,580 | ||||||
| Buildings and land improvements | 5,142 | 4,975 | ||||||||
| Equipment | 7,980 | 7,797 | ||||||||
| Leasehold improvements | 3,917 | 3,804 | ||||||||
| Construction-in-progress | 511 | 541 | ||||||||
| Leased property under capital leases and financing obligations | 561 | 506 | ||||||||
| 19,786 | 19,203 | |||||||||
| Accumulated depreciation and amortization | (8,421 | ) | (7,706 | ) | ||||||
| Total | $ | 11,365 | $ | 11,497 | ||||||
Approximately $566 and $252 at January 29, 2005.
4. TAXES, BASEDON INCOME
| 2006 | 2005 | 2004 | |||||
| Federal | |||||||
| Current | $652 | $609 | $ 96 | ||||
| Deferred | (52 | ) | (79 | ) | 258 | ||
| 600 | 530 | 354 | |||||
| State and local | |||||||
| Current | 55 | 42 | 25 | ||||
| Deferred | (22 | ) | (5 | ) | 11 | ||
| 33 | 37 | 36 | |||||
| Total | $633 | $567 | $390 | ||||
| 2005 | 2004 | 2003 | ||||||||||||
|---|---|---|---|---|---|---|---|---|---|---|---|---|---|---|
| Federal | ||||||||||||||
| Current | $ | 609 | $ | 96 | $ | 177 | ||||||||
| Deferred | (79 | ) | 258 | 238 | ||||||||||
| 530 | 354 | 415 | ||||||||||||
| State and local | ||||||||||||||
| Current | 42 | 25 | 18 | |||||||||||
| Deferred | (5 | ) | 11 | 21 | ||||||||||
| 37 | 36 | 39 | ||||||||||||
| Total | $ | 567 | $ | 390 | $ | 454 | ||||||||
| 2006 | 2005 | 2004 | ||||||
| Statutory rate | 35.0 | % | 35.0 | % | 35.0 | % | ||
| State income taxes, net of federal tax benefit | 1.9 | % | 1.6 | % | 2.6 | % | ||
| Non-deductible goodwill | — | — | 101.7 | % | ||||
| Deferred tax adjustment | (1.2 | )% | — | — | ||||
| Other changes, net | 0.5 | % | 0.6 | % | (2.9 | )% | ||
| 36.2 | % | 37.2 | % | 136.4 | % | |||
During the reconciliation of the Company’s deferred tax balances, after the filing of annual federal and state tax returns, the Company identified adjustments to be made in the prior years’ deferred tax reconciliation. These deferred tax balances were corrected in the Company’s Consolidated Financial Statements for the year ended February 3, 2007, which resulted in a reduction of the Company’s 2006 provision for income tax expense of approximately $21. The Company does not believe these adjustments are material to its Consolidated Financial Statements for the year ended February 3, 2007, or to any prior years’ Consolidated Financial Statements. As a result, the Company has not restated any prior year amounts.
| 2005 | 2004 | 2003 | ||||||||||||
|---|---|---|---|---|---|---|---|---|---|---|---|---|---|---|
| Statutory rate | 35.0 | % | 35.0 | % | 35.0 | % | ||||||||
| State income taxes, net of federal tax benefit | 1.6 | % | 2.6 | % | 3.4 | % | ||||||||
| Non-deductible goodwill | 0.0 | % | 101.7 | % | 22.3 | % | ||||||||
| Other changes, net | 0.6 | % | (2.9 | )% | 0.7 | % | ||||||||
| 37.2 | % | 136.4 | % | 61.4 | % | |||||||||
| 2005 | 2004 | |||||||||
|---|---|---|---|---|---|---|---|---|---|---|
| Current deferred tax assets: | ||||||||||
| Net operating loss carryforwards | $ | 18 | $ | 19 | ||||||
| Other | 42 | — | ||||||||
| Total current deferred tax assets | 60 | 19 | ||||||||
| Current deferred tax liabilities: | ||||||||||
| Compensation related costs | (2 | ) | (19 | ) | ||||||
| Insurance related costs | (107 | ) | (136 | ) | ||||||
| Inventory related costs | (168 | ) | (119 | ) | ||||||
| Other | — | (31 | ) | |||||||
| Total current deferred tax liabilities | (277 | ) | (305 | ) | ||||||
| Current deferred taxes | $ | (217 | ) | $ | (286 | ) | ||||
| Long-term deferred tax assets: | ||||||||||
| Compensation related costs | $ | 290 | $ | 383 | ||||||
| Insurance related costs | 9 | 15 | ||||||||
| Lease accounting | 106 | 60 | ||||||||
| Closed store reserves | 95 | 115 | ||||||||
| Net operating loss carryforwards | 26 | 79 | ||||||||
| Other | 21 | 147 | ||||||||
| Long-term deferred tax assets, net | 547 | 799 | ||||||||
| Long-term deferred tax liabilities: | ||||||||||
| Depreciation | (1,193 | ) | (1,437 | ) | ||||||
| Deferred income | (197 | ) | (203 | ) | ||||||
| Total long-term deferred tax liabilities | (1,390 | ) | (1,640 | ) | ||||||
| Long-term deferred taxes | $ | (843 | ) | $ | (841 | ) | ||||
| 2006 | 2005 | ||||||
| Current deferred tax assets: | |||||||
| Net operating loss carryforwards | $ | 17 | $ | 18 | |||
| Compensation related costs | 32 | — | |||||
| Other | 4 | 42 | |||||
| Total current deferred tax assets | 53 | 60 | |||||
| Current deferred tax liabilities: | |||||||
| Compensation related costs | — | (2 | ) | ||||
| Insurance related costs | (109 | ) | (107 | ) | |||
| Inventory related costs | (212 | ) | (168 | ) | |||
| Total current deferred tax liabilities | (321 | ) | (277 | ) | |||
| Current deferred taxes | $ | (268 | ) | $ | (217 | ) | |
| Long-term deferred tax assets: | |||||||
| Compensation related costs | $ | 332 | $ | 290 | |||
| Insurance related costs | — | 9 | |||||
| Lease accounting | 122 | 106 | |||||
| Closed store reserves | 96 | 95 | |||||
| Net operating loss carryforwards | 29 | 26 | |||||
| Other | 47 | 21 | |||||
| Long-term deferred tax assets, net | 626 | 547 | |||||
| Long-term deferred tax liabilities: | |||||||
| Depreciation | (1,114 | ) | (1,193 | ) | |||
| Insurance related costs | (33 | ) | — | ||||
| Deferred income | (201 | ) | (197 | ) | |||
| Total long-term deferred tax liabilities | (1,348 | ) | (1,390 | ) | |||
| Long-term deferred taxes | $ | (722 | ) | $ | (843 | ) | |
5. DEBT OBLIGATIONS
| 2006 | 2005 | ||||
| Credit facility | $ 352 | $ — | |||
| 4.95% to 9.20% Senior notes and debentures due through 2031 | 5,916 | 6,390 | |||
| 5.00% to 9.95% mortgages due in varying amounts through 2034 | 169 | 179 | |||
| Other | 144 | 178 | |||
| Total debt | 6,581 | 6,747 | |||
| Less current portion | (878 | ) | (527 | ) | |
| Total long-term debt | $5,703 | $6,220 | |||
| 2005 | 2004 | |||||||||
|---|---|---|---|---|---|---|---|---|---|---|
| Credit Facilities | $ | — | $ | 694 | ||||||
| 4.95% to 8.92% Senior Notes and Debentures due through 2031 | 6,390 | 6,391 | ||||||||
| 5.00% to 9.95% mortgages due in varying amounts through 2017 | 179 | 218 | ||||||||
| Other | 178 | 202 | ||||||||
| Total debt | 6,747 | 7,505 | ||||||||
| Less current portion | (527 | ) | (46 | ) | ||||||
| Total long-term debt | $ | 6,220 | $ | 7,459 | ||||||
| 2007 | $ | 878 |
| 2008 | 993 | |
| 2009 | 912 | |
| 2010 | 42 | |
| 2011 | 537 | |
| Thereafter | 3,219 | |
| Total debt | $ | 6,581 |
6. FINANCIAL INSTRUMENTS
| 2006 | $ | 527 | ||||
| 2007 | 527 | |||||
| 2008 | 1,000 | |||||
| 2009 | 912 | |||||
| 2010 | 42 | |||||
| Thereafter | 3,739 | |||||
| Total debt | $ | 6,747 |
| 2005 | 2004 | ||||||||||||||||||
|---|---|---|---|---|---|---|---|---|---|---|---|---|---|---|---|---|---|---|---|
| Pay Floating | Pay Fixed | Pay Floating | Pay Fixed | ||||||||||||||||
| Notional amount | $ | 1,375 | $ | — | $ | 1,375 | $ | — | |||||||||||
| Duration in years | 3.28 | — | 4.29 | — | |||||||||||||||
| Average variable rate | 8.14 | % | — | 6.29 | % | — | |||||||||||||
| Average fixed rate | 6.98 | % | — | 6.98 | % | — | |||||||||||||
| 2006 | 2005 | ||||||||
| Pay | Pay | Pay | Pay | ||||||
| Floating | Fixed | Floating | Fixed | ||||||
| Notional amount | $1,050 | $ — | $1,375 | $ — | |||||
| Duration in years | 3.08 | — | 3.28 | — | |||||
| Average variable rate | 8.07 | % | — | 8.14 | % | — | |||
| Average fixed rate | 6.74 | % | — | 6.98 | % | — | |||
INSTRUMENTS
| 2005 | 2004 | ||||||||||||||||||
|---|---|---|---|---|---|---|---|---|---|---|---|---|---|---|---|---|---|---|---|
| Carrying Value | Estimated Fair Value | Carrying Value | Estimated Fair Value | ||||||||||||||||
| Cash and temporary cash investments | $ | 210 | $ | 210 | $ | 144 | $ | 144 | |||||||||||
| Store deposits in-transit | $ | 488 | $ | 488 | $ | 506 | $ | 506 | |||||||||||
| Long-term investments for which it is | |||||||||||||||||||
| Practicable | $ | 118 | $ | 118 | $ | 89 | $ | 89 | |||||||||||
| Not Practicable | $ | 1 | $ | — | $ | 15 | $ | — | |||||||||||
| Debt for which it is(1) | |||||||||||||||||||
| Practicable | $ | (6,747 | ) | $ | (7,038 | ) | $ | (7,505 | ) | $ | (8,304 | ) | |||||||
| Not Practicable | $ | — | $ | — | $ | — | $ | — | |||||||||||
| Interest Rate Protection Agreements | |||||||||||||||||||
| Receive fixed swaps(2) | $ | (34 | ) | $ | (34 | ) | $ | (11 | ) | $ | (11 | ) | |||||||
| Forward-starting swaps(3) | $ | (2 | ) | $ | (2 | ) | $ | — | $ | — | |||||||||
| Corrugated Cardboard Price Protection Agreements(4) | $ | 3 | $ | 3 | $ | (2 | ) | $ | (2 | ) | |||||||||
| 2006 | 2005 | ||||||||||||||
| Carrying | Estimated | Carrying | Estimated | ||||||||||||
| Value | Fair Value | Value | Fair Value | ||||||||||||
| Cash and temporary cash investments | $ | 189 | $ | 189 | $ | 210 | $ | 210 | |||||||
| Store deposits in-transit | $ | 614 | $ | 614 | $ | 488 | $ | 488 | |||||||
| Long-term investments for which it is | |||||||||||||||
| Practicable | $ | 152 | $ | 152 | $ | 118 | $ | 118 | |||||||
| Not Practicable | $ | — | $ | — | $ | 1 | $ | — | |||||||
| Debt for which it is(1) | |||||||||||||||
| Practicable | $ | (6,581 | ) | $ | (6,859 | ) | $ | (6,747 | ) | $ | (7,038 | ) | |||
| Not Practicable | $ | — | $ | — | $ | — | $ | — | |||||||
| Interest Rate Protection Agreements | |||||||||||||||
| Receive fixed swaps asset/(liability)(2) | $ | (28 | ) | $ | (28 | ) | $ | (34 | ) | $ | (34 | ) | |||
| Forward-starting swap asset/(liability)(3) | $ | 12 | $ | 12 | $ | (2 | ) | $ | (2 | ) | |||||
| Corrugated Cardboard Price Protection Agreements(4) | $ | — | $ | — | $ | 3 | $ | 3 | |||||||
| (1) | Excludes capital lease and lease-financing obligations. |
| (2) | As of | |
| (3) | As of | |
| (4) | See Note | |
A-51
8. LEASESAND LEASE- FINANCED TRANSACTIONS
The Company operates primarily in leased facilities. Lease terms generally range from 10 to 20 years with options to renew for varying terms. Terms of certain leases include escalation clauses, percentage rent based on sales or payment of executory costs such as property taxes, utilities or insurance and maintenance. Rent expense for leases with escalation clauses, capital improvement funding or other lease concessions is accounted for on a straight-line basis beginning with the earlier of the lease commencement date or the date the Company takes possession. Portions of certain properties are subleased to others for periods generally ranging from one to 20 years.
| 2005 | 2004 | 2003 | ||||||||||||
|---|---|---|---|---|---|---|---|---|---|---|---|---|---|---|
| Minimum rentals | $ | 760 | $ | 772 | $ | 744 | ||||||||
| Contingent payments | 8 | 9 | 9 | |||||||||||
| Sublease income | (107 | ) | (101 | ) | (96 | ) | ||||||||
| $ | 661 | $ | 680 | $ | 657 | |||||||||
| 2006 | 2005 | 2004 | |||||||||
| Minimum rentals | $ | 753 | $ | 760 | $ | 772 | |||||
| Contingent payments | 10 | 8 | 9 | ||||||||
| Sublease income | (114 | ) | (107 | ) | (101 | ) | |||||
| Total rent expense | $ | 649 | $ | 661 | $ | 680 | |||||
| Capital Leases | Operating Leases | Lease- Financed Transactions | ||||||||||||
|---|---|---|---|---|---|---|---|---|---|---|---|---|---|---|
| 2006 | $ | 61 | $ | 784 | $ | 3 | ||||||||
| 2007 | 57 | 732 | 3 | |||||||||||
| 2008 | 54 | 684 | 3 | |||||||||||
| 2009 | 52 | 635 | 3 | |||||||||||
| 2010 | 51 | 588 | 4 | |||||||||||
| Thereafter | 344 | 4,075 | 96 | |||||||||||
| 619 | $ | 7,498 | $ | 112 | ||||||||||
| Less estimated executory costs included in capital leases | (3 | ) | ||||||||||||
| Net minimum lease payments under capital leases | 616 | |||||||||||||
| Less amount representing interest | (270 | ) | ||||||||||||
| Present value of net minimum lease payments under capital leases | $ | 346 | ||||||||||||
| Lease- | ||||||||||
| Capital | Operating | Financed | ||||||||
| Leases | Leases | Transactions | ||||||||
| 2007 | $ 57 | $ 778 | $ 3 | |||||||
| 2008 | 54 | 734 | 3 | |||||||
| 2009 | 52 | 690 | 4 | |||||||
| 2010 | 51 | 642 | 4 | |||||||
| 2011 | 49 | 587 | 4 | |||||||
| Thereafter | 294 | 4,118 | 93 | |||||||
| 557 | $7,549 | $111 | ||||||||
| Less estimated executory costs included in capital leases | (3 | ) | ||||||||
| Net minimum lease payments under capital leases | 554 | |||||||||
| Less amount representing interest | (237 | ) | ||||||||
| Present value of net minimum lease payments under capital leases | $ 317 | |||||||||
A-52
NOTESTO CONSOLIDATED FINANCIALSTATEMENTS, CONTINUED
Basic earnings (loss) per common share equals net earnings (loss) divided by the weighted average number of common shares outstanding. Diluted earnings per common share equals net earnings (loss) divided by the weighted average number of common shares outstanding after giving effect to dilutive stock options and warrants.
| For the year ended January 28, 2006 | For the year ended January 29, 2005 | For the year ended January 31, 2004 | |||||||||||||||||||||||||||||||||||||
|---|---|---|---|---|---|---|---|---|---|---|---|---|---|---|---|---|---|---|---|---|---|---|---|---|---|---|---|---|---|---|---|---|---|---|---|---|---|---|---|
| Earnings (Numer- ator) | Shares (Denomi- nator) | Per Share Amount | Earnings (Numer- ator) | Shares (Denomi- nator) | Per Share Amount | Earnings (Numer- ator) | Shares (Denomi- nator) | Per Share Amount | |||||||||||||||||||||||||||||||
| Basic EPS | $ | 958 | 724 | $ | 1.32 | $ | (104 | ) | 736 | $ | (0.14 | ) | $ | 285 | 747 | $ | 0.38 | ||||||||||||||||||||||
| Dilutive effect of stock option awards and warrants | 7 | — | 7 | ||||||||||||||||||||||||||||||||||||
| Diluted EPS | $ | 958 | 731 | $ | 1.31 | $ | (104 | ) | 736 | $ | (0.14 | ) | $ | 285 | 754 | $ | 0.38 | ||||||||||||||||||||||
| For the year ended | For the year ended | For the year ended | |||||||||||||||||||||||
| February 3, 2007 | January 28, 2006 | January 29, 2005 | |||||||||||||||||||||||
| Earnings | Shares | Per | Earnings | Shares | Per | Loss | Shares | Per | |||||||||||||||||
| (in millions, except per | (Nume- | (Denomi- | Share | (Nume- | (Denomi- | Share | (Nume- | (Denomi- | Share | ||||||||||||||||
| share amounts) | rator) | nator) | Amount | rator) | nator) | Amount | rator) | nator) | Amount | ||||||||||||||||
| Basic EPS | $ | 1,115 | 715 | $ | 1.56 | $ | 958 | 724 | $ | 1.32 | $ | (104) | 736 | $ | (0.14 | ) | |||||||||
| Dilutive effect of stock | |||||||||||||||||||||||||
| optionawards and | |||||||||||||||||||||||||
| warrants | 8 | 7 | — | ||||||||||||||||||||||
| Diluted EPS | $ | 1,115 | 723 | $ | 1.54 | $ | 958 | 731 | $ | 1.31 | $ | (104) | 736 | $ | (0.14 | ) | |||||||||
Stock options by exchanging issued shares of stock of the Company. At January 28, 2006, approximately 22.0 shares of common stock were available for future options under these plans. Options generally willtypically expire 10 years from the date of grant. OptionsStock options vest inbetween one year toand five years from the date of grant or, for certain stock options, the earlier of the Company’s stock reaching certain pre-determined and appreciated market prices or nine years and six months from the date of grant.
A-53
NOTESTO CONSOLIDATED FINANCIAL STATEMENTS, CONTINUED
In addition to the stock options described above, the Company also awards restricted stock to employees under various plans. The restrictions on these awards generally lapse inbetween one year toand five years from the date of the awards and expense is recognized over the lapsing cycle. TheUnder APB No. 25, the Company generally recordsrecorded expense for restricted stock awards in an amount equal to the fair market value of the underlying stock on the date of award. The Company issued approximately 0.1, 0.2 and 0.7 shares of restricted stock in 2005, 2004 and 2003, respectively. As of January 28, 2006,February 3, 2007, approximately 8.0six million shares of common stock were available for future restricted stock awards.awards under the 2005 Long-Term Incentive Plan (the “Plan”). The Company has the ability to convert shares available for issuancestock options under the 2005 Long-Term Incentive Plan to shares available for restricted stock awards. Four shares available for othercommon stock awards can be converted into one share available for restricted stock awards. Compensation expense included
All awards become immediately exercisable upon certain changes of control of the Company.
Historically, stock option awards were granted to various employees throughout the organization. Restricted stock awards, however, were limited to approximately 150 associates, including members of the Board of Directors and certain members of senior management. Beginning in net earnings for2006, the Company began issuing a combination of stock option and restricted stock awards totaled approximately $5, $8to those employees who previously received only stock option awards, in an effort to further align those employees’ interests with those of the Company’s non-employee shareholders. As a result, the number of stock option awards granted in 2006 decreased and $8, after-tax, in 2005, 2004 and 2003, respectively.
Changes in options outstanding under the stock option plans excluding restricted stock awards, were:are summarized below:
| Weighted- | ||||||
| Shares subject | average | |||||
| to option | exercise | |||||
| (in millions) | price | |||||
| Outstanding, year-end 2003 | 60.1 | $ | 17.62 | |||
| Granted | 6.7 | $ | 17.28 | |||
| Exercised | (4.2 | ) | $ | 7.29 | ||
| Canceled or Expired | (1.1 | ) | $ | 20.99 | ||
| Outstanding, year-end 2004 | 61.5 | $ | 18.20 | |||
| Granted | 6.8 | $ | 16.50 | |||
| Exercised | (7.7 | ) | $ | 9.81 | ||
| Canceled or Expired | (1.3 | ) | $ | 20.92 | ||
| Outstanding, year-end 2005 | 59.3 | $ | 19.03 | |||
| Granted | 3.2 | $ | 20.05 | |||
| Exercised | (9.5 | ) | $ | 13.34 | ||
| Canceled or Expired | (1.1 | ) | $ | 21.01 | ||
| Outstanding, year-end 2006 | 51.9 | $ | 20.09 | |||
| Shares subject to option | Weighted- average Exercise price | |||||||||
|---|---|---|---|---|---|---|---|---|---|---|
| Outstanding, year-end 2002 | 66.2 | $ | 16.97 | |||||||
| Granted | 0.3 | $ | 16.34 | |||||||
| Exercised | (4.9 | ) | $ | 7.59 | ||||||
| Canceled or Expired | (1.5 | ) | $ | 21.19 | ||||||
| Outstanding, year-end 2003 | 60.1 | $ | 17.62 | |||||||
| Granted | 6.7 | $ | 17.28 | |||||||
| Exercised | (4.2 | ) | $ | 7.29 | ||||||
| Canceled or Expired | (1.1 | ) | $ | 20.99 | ||||||
| Outstanding, year-end 2004 | 61.5 | $ | 18.20 | |||||||
| Granted | 6.8 | $ | 16.50 | |||||||
| Exercised | (7.7 | ) | $ | 9.81 | ||||||
| Canceled or Expired | (1.3 | ) | $ | 20.92 | ||||||
| Outstanding, year-end 2005 | 59.3 | $ | 19.03 | |||||||
| Weighted- | ||||||||||||
| average | Weighted- | Weighted- | ||||||||||
| Range of | Number | remaining | average | Options | average | |||||||
| Exercise Prices | outstanding | contractual life | exercise price | exercisable | exercise price | |||||||
| (in millions) | (in years) | (in millions) | ||||||||||
| $ 9.90 - $14.93 | 7.9 | 4.51 | $ | 14.45 | 7.1 | $ | 14.39 | |||||
| $14.94 - $16.39 | 6.1 | 8.16 | $ | 16.35 | 2.2 | $ | 16.31 | |||||
| $16.40 - $17.31 | 10.4 | 5.32 | $ | 16.97 | 7.1 | $ | 16.90 | |||||
| $17.32 - $22.99 | 9.2 | 4.24 | $ | 20.96 | 5.0 | $ | 21.40 | |||||
| $23.00 - $31.91 | 18.3 | 3.76 | $ | 25.13 | 15.0 | $ | 25.20 | |||||
| $ 9.90 - $31.91 | 51.9 | 4.79 | $ | 20.09 | 36.4 | $ | 20.42 | |||||
The weighted-average remaining contractual life for options exercisable at February 3, 2007, was approximately 4.1 years.
Restricted stock
| Restricted | Weighted- | |||||
| shares | average | |||||
| outstanding | grant-date | |||||
| (in millions) | fair value | |||||
| Outstanding, year-end 2005 | 0.7 | $ | 17.85 | |||
| Granted | 2.2 | $ | 20.16 | |||
| Lapsed | (0.4 | ) | $ | 17.46 | ||
| Canceled or Expired | (0.1 | ) | $ | 19.41 | ||
| Outstanding, year-end 2006 | 2.4 | $ | 20.02 | |||
Adoption of SFAS No. 123(R)
Effective January 28,29, 2006, follows:
In accordance with the provisions of the modified-prospective transition method, results for prior periods have not been restated. Compensation expense for all share-based awards described above was recognized using the straight-line attribution method applied to the fair value of each option grant, over the requisite service period associated with each award. The requisite service period is typically consistent with the vesting period, except as noted below. Because awards typically vest evenly over the requisite service period, compensation cost recognized through February 3, 2007, is at least equal to the grant-date fair value of the vested portion of all outstanding awards. All of the Company stock-based incentive plans are considered equity plans under SFAS No. 123(R).
A-55
NOTESTO CONSOLIDATED FINANCIALSTATEMENTS, CONTINUED
The weighted-average fair value of stock options granted during 2006, 2005 and 2004 was $6.90, $7.70 and $7.91, respectively. The fair value of each stock option grant was estimated on the date of grant using the Black-Scholes option-pricing model, based on the assumptions shown in the table below. The Black-Scholes model utilizes extensive accounting judgment and financial estimates, including the term employees are expected to retain their stock options before exercising them, the volatility of the Company’s stock price over that expected term, the dividend yield over the term and the number of awards expected to be forfeited before they vest. Using alternative assumptions in the calculation of fair value would produce fair values for stock option grants that could be different than those used to record stock-based compensation expense in the Consolidated Statements of Operations.
The following table reflects the weighted-average assumptions used for grants awarded to option holders:
| 2006 | 2005 | 2004 | |||||||
| Weighted average expected volatility (based on historical | |||||||||
| volatility) | 27.60 | % | 30.83 | % | 30.13 | % | |||
| Weighted average risk-free interest rate | 5.07 | % | 4.11 | % | 3.99 | % | |||
| Expected dividend yield | 1.50 | % | N/A | N/A | |||||
| Expected term (based on historical results) | 7.5 years | 8.7 years | 8.7 years | ||||||
| Range of Exercise Prices | | Number Outstanding | | Weighted- Average Remaining Contractual Life | | Weighted- Average Exercise Price | | Options Exercisable | | Weighted- Average Exercise Price | ||||||||||||
|---|---|---|---|---|---|---|---|---|---|---|---|---|---|---|---|---|---|---|---|---|---|---|
| (In years) | ||||||||||||||||||||||
| $ 5.66 - $14.92 | 8.1 | 0.90 | $ | 11.70 | 8.1 | $ | 11.69 | |||||||||||||||
| $14.93 - $16.38 | 7.3 | 6.86 | $ | 14.95 | 5.3 | $ | 14.94 | |||||||||||||||
| $16.39 - $17.30 | 12.1 | 6.89 | $ | 16.48 | 4.8 | $ | 16.59 | |||||||||||||||
| $17.31 - $22.26 | 12.7 | 5.32 | $ | 19.37 | 7.5 | $ | 20.06 | |||||||||||||||
| $22.27 - $31.91 | 19.1 | 4.77 | $ | 25.10 | 15.2 | $ | 25.23 | |||||||||||||||
| $ 5.66 - $31.91 | 59.3 | 5.05 | $ | 19.03 | 40.9 | $ | 19.24 | |||||||||||||||
The weighted-average risk-free interest rate was based on the yield of a treasury note as of the grant date, continuously compounded, which matures at a date that approximates the expected term of options. During the years presented, prior to 2006, the Company did not pay a dividend, so an expected dividend rate was not included in the determination of fair value for options granted during those years. Using a dividend yield of 1.50% to value options issued in 2005 would have decreased the fair value of each option by approximately $1.60. Expected volatility was determined based upon historical stock volatilities. Implied volatility was also considered. Expected term was determined based upon a combination of historical exercise and cancellation experience as well as estimates of expected future exercise and cancellation experience.
Under SFAS No. 123(R), the Company records expense for restricted stock awards in an amount equal to the fair market value of the underlying stock on the grant date of the award, over the period the awards lapse.
Total stock compensation recognized in 2006 was $72. This included $50 for stock options and $22 for restricted shares. A total of $18 of the restricted stock expense was attributable to the wider distribution of restricted shares incorporated into the first quarter 2006 grant of share-based awards, and the remaining $4 of restricted stock expense related to previously issued restricted stock awards. The incremental compensation expense attributable to the adoption of SFAS No. 123(R) in 2006 was $68, pre-tax, or $43 and $0.06 per basic and diluted share, after tax. Stock compensation cost recognized in 2005, related entirely to restricted stock grants, was $7, pre-tax. These costs were recognized as operating, general and administrative expense in the Company’s Consolidated Statements of Operations. The cumulative effect of applying a forfeiture rate to unvested restricted shares at January 29, 2006 was not material.
A-56
NOTESTO CONSOLIDATED FINANCIAL STATEMENTS, CONTINUED
If compensation cost for the Company’s stock option plans for the years ended January 28, 2006 and January 29, 2005 had been determined based upon the fair value at the grant date for awards under these plans consistent with the methodology prescribed under SFAS No. 123,Accounting for Stock-Based Compensation, the Company’s net earnings and diluted earnings per common share would have been reduced to the pro forma amounts below:
| 2005 | 2004 | |||||||
| Net earnings (loss), as reported | $ | 958 | $ | (104 | ) | |||
| Stock-based compensation expense included in net earnings, | ||||||||
| net ofincome tax benefits | 5 | 8 | ||||||
| Total stock-based compensation expense determined under fair | ||||||||
| valuemethod for all awards, net of income tax benefits | (34 | ) | (48 | ) | ||||
| Pro forma net earnings (loss) | $ | 929 | $ | (144 | ) | |||
| Earnings (loss) per basic common share, as reported | $ | 1.32 | $ | (0.14 | ) | |||
| Pro forma earnings (loss) per basic common share | $ | 1.28 | $ | (0.20 | ) | |||
| Earnings (loss) per diluted common share, as reported | $ | 1.31 | $ | (0.14 | ) | |||
| Pro forma earnings (loss) per diluted common share | $ | 1.27 | $ | (0.20 | ) | |||
| 2005 | 2004 | 2003 | |||||||||||||||||||||||||
|---|---|---|---|---|---|---|---|---|---|---|---|---|---|---|---|---|---|---|---|---|---|---|---|---|---|---|---|
| Actual | Pro Forma | Actual | Pro Forma | Actual | Pro Forma | ||||||||||||||||||||||
| Net earnings (loss) | $ | 958 | $ | 929 | $ | (104 | ) | $ | (144 | ) | $ | 285 | $ | 245 | |||||||||||||
| Earnings (loss) per diluted common share | $ | 1.31 | $ | 1.27 | $ | (0.14 | ) | $ | (0.20 | ) | $ | 0.38 | $ | 0.32 | |||||||||||||
| 2005 | 2004 | 2003 | ||||||||||||
|---|---|---|---|---|---|---|---|---|---|---|---|---|---|---|
| Weighted average expected volatility (based on historical volatility) | 30.83 | % | 30.13 | % | 30.23 | % | ||||||||
| Weighted average risk-free interest rate | 4.11 | % | 3.99 | % | 3.33 | % | ||||||||
| Expected term (based on historical results) | 8.7 | years | 8.7 | years | 8.5 | years | ||||||||
Shares issued as a result of stock option exercises may be newly issued shares or reissued treasury shares. Proceeds received from the exercise of options, and the related tax benefit, are utilized to repurchase shares of the Company’s stock under a stock repurchase program adopted by the Company’s Board of Directors. During 2006, the Company repurchased approximately 11 million shares of stock in such a manner.
For share-based awards granted during 2005, 2004 and 2003 was $7.70, $7.91 and $7.09, respectively. The Company utilizes a risk-free interest rate basedprior to the adoption of SFAS No. 123(R), the Company’s stock option grants generally contained retirement-eligibility provisions that caused the options to vest upon the yield of a treasury note maturing at a date that approximates the option’s vest date.
ONTINGENCIES
dispute in southern California, violated Section 1 of the Sherman Act. The lawsuit seeks declarative and injunctive relief. On May 25, 2005, the Court denied a motion for a summary judgment filed by the defendants. Ralphs and the other defendants filed a notice of an interlocutory appeal to the United States Court of Appeals for the Ninth Circuit. On November 29, 2005, the appellate court dismissed the appeal. On December 7, 2006, the Court denied a motion for summary judgment filed by the State of California. The Company continues to believe it has strong defenses against this lawsuit and is vigorously defending it. Although this lawsuit is subject to uncertainties inherent to the litigation process, based on the information presently available to the Company, management does not expect that the ultimate resolution of this action will have a material adverse effect
A-58
NOTESTO CONSOLIDATED FINANCIAL STATEMENTS, CONTINUED
allege that Ralphs violated various laws protecting consumers in connection with a promotion pursuant to which Ralphs offered travel awards to customers. On February 22, 2006, the Court inThe Great Escape Promotion Cases issued an Order granting preliminary approval of the class action settlement. Notice of the class action should besettlement was sent to class members, within the next 90 days, and the date set for final approval ofCourt issued an Order finally approving the class action is set forsettlement on August 25, 2006. The Company has no reasonsettlement involved the issuance of coupons and gift cards. While the ultimate cost of the settlement to believe that final approval will not be obtained, andRalphs is largely dependent on the rate of coupon redemption, management does not believeexpect that the ultimate outcomeresolution of this action will have a material adverse effect on the Company’s financial condition.condition, results of operations or cash flows.
the leases if any of the assignees are unable to fulfill their lease obligations. Due to the wide distribution of the Company’s assignments among third parties, and various other remedies available, the Company believes the likelihood that it will be required to assume a material amount of these obligations is remote.
A-59
N14.OTESTO CONSOLIDATED FINANCIAL SUBSEQUENT EVENTSTATEMENTS
On March 7, 2006,15, 2007, the Company announced its Board of Directors declared the payment of a quarterly dividend of $0.065$0.075 per share, payable on June 1, 2007, to shareholders of record as of the close of business on May 15, 2006 to be paid on June 1, 2006.
A-58A-60
status of its retirement plans on the Consolidated Balance Sheet. Actuarial gains or losses, prior service costs or credits and transition obligations that have not yet been recognized are now required to be recorded as a component of Accumulated Other Comprehensive Income (“AOCI”). The following table reflects the effects the adoption of SFAS No. 158 had on our Consolidated Balance Sheet as of February 3, 2007.
| Before | After | ||||||||||||
| Application | Application | ||||||||||||
| of SFAS No. | of SFAS No. | ||||||||||||
| February 3, 2007 | 158 | Adjustments | 158 | ||||||||||
| Other assets | $ | 497 | $ | (8 | ) | $ | 489 | ||||||
| Total assets | $ | 21,223 | $ | (8 | ) | $ | 21,215 | ||||||
| Deferred income taxes | $ | 792 | $ | (70 | ) | $ | 722 | ||||||
| Other long-term liabilities | $ | 1,653 | $ | 182 | $ | 1,835 | |||||||
| Total liabilities | $ | 16,180 | $ | 112 | $ | 16,292 | |||||||
| Accumulated other comprehensive loss | $ | (139 | ) | $ | (120 | ) | $ | (259 | ) | ||||
| Total shareowners’ equity | $ | 5,043 | $ | (120 | ) | $ | 4,923 | ||||||
| Total liabilities and shareowners’ equity | $ | 21,223 | $ | (8 | ) | $ | 21,215 | ||||||
Amounts recognized in AOCI as of February 3, 2007 consist of the following (pre-tax):
| Pension | Other | ||||||||||||
| February 3, 2007 | Benefits | Benefits | Total | ||||||||||
| Unrecognized net actuarial loss | $433 | $ | 28 | $ | 461 | ||||||||
| Unrecognized prior service cost (credit) | 7 | (42 | ) | (35 | ) | ||||||||
| Unrecognized transition obligation | 1 | — | 1 | ||||||||||
| Total amounts deferred in AOCI | $441 | $ | (14 | ) | $ | 427 | |||||||
Amounts in AOCI expected to be recognized as components of net periodic pension or postretirement benefit costs in 2007 are as follows (pre-tax):
| Pension | Other | ||||||||||
| February 3, 2007 | Benefits | Benefits | Total | ||||||||
| Net actuarial loss | $35 | $— | $ | 35 | |||||||
| Prior service cost | 2 | (6 | ) | (4 | ) | ||||||
| Total | $37 | $ (6 | ) | $ | 31 | ||||||
A-61
NOTESTO CONSOLIDATED FINANCIAL STATEMENTS, CONTINUED
| Pension Benefits | ||||||||||||||||||||||||
| Qualified Plans | Non-Qualified Plan | Other Benefits | ||||||||||||||||||||||
| 2006 | 2005 | 2006 | 2005 | 2006 | 2005 | |||||||||||||||||||
| Change in benefit obligation: | ||||||||||||||||||||||||
| Benefit obligation at beginning of fiscal year | $ | 2,284 | $ | 2,019 | $ | 105 | $ | 113 | $ | 356 | $ | 366 | ||||||||||||
| Service cost | 123 | 118 | 2 | 1 | 13 | 12 | ||||||||||||||||||
| Interest cost | 130 | 113 | 6 | 6 | 20 | 19 | ||||||||||||||||||
| Plan participants’ contributions | — | — | — | — | 11 | 9 | ||||||||||||||||||
| Amendments | — | — | 3 | — | 4 | |||||||||||||||||||
| Actuarial (gain) loss | (4 | ) | 145 | 7 | (12 | ) | 4 | (22 | ) | |||||||||||||||
| Benefits paid | (114 | ) | (111 | ) | (7 | ) | (6 | ) | (31 | ) | (32 | ) | ||||||||||||
| Benefit obligation at end of fiscal year | $ | 2,419 | $ | 2,284 | $ | 113 | $ | 105 | $ | 373 | $ | 356 | ||||||||||||
| Change in plan assets: | ||||||||||||||||||||||||
| Fair value of plan assets at beginning of fiscal year | $ | 1,814 | $ | 1,458 | $ | — | $ | — | $ | — | $ | — | ||||||||||||
| Actual return on plan assets | 248 | 167 | — | — | — | — | ||||||||||||||||||
| Employer contributions | 150 | 300 | 7 | 6 | 20 | 23 | ||||||||||||||||||
| Plan participants’ contributions | — | — | — | — | 11 | 9 | ||||||||||||||||||
| Benefits paid | (114 | ) | (111 | ) | (7 | ) | (6 | ) | (31 | ) | (32 | ) | ||||||||||||
| Fair value of plan assets at end of fiscal year | $ | 2,098 | $ | 1,814 | $ | — | $ | — | $ | — | $ | — | ||||||||||||
| Funded status at end of fiscal year | $ | (321 | ) | $ | (470 | ) | $ | (113 | ) | $ | (105 | ) | $ | (373 | ) | $ | (356 | ) | ||||||
| Pension Benefits | ||||||||||||||||||||||||
| Qualified Plans | Non-Qualified Plan | Other Benefits | ||||||||||||||||||||||
| 2006(1) | 2005 | 2006(1) | 2005 | 2006(1) | 2005 | |||||||||||||||||||
| Funded status at end of year | $ | (321 | ) | $ | (470 | ) | $ | (113 | ) | $ | (105 | ) | $ | (373 | ) | $ | (356 | ) | ||||||
| Unrecognized actuarial (gain) loss | — | 541 | — | 27 | — | 23 | ||||||||||||||||||
| Unrecognized prior service cost | — | 9 | — | 8 | — | (49 | ) | |||||||||||||||||
| Unrecognized net transition (asset) obligation | — | (1 | ) | — | 1 | — | 1 | |||||||||||||||||
| Net asset (liability) recognized at end of fiscal year | $ | (321 | ) | $ | 79 | $ | (113 | ) | $ | (69 | ) | $ | (373 | ) | $ | (381 | ) | |||||||
| Accrued benefit liability | $ | (321 | ) | $ | (217 | ) | $ | (113 | ) | $ | (112 | ) | $ | (386 | ) | $ | (381 | ) | ||||||
| Additional minimum liability | — | (80 | ) | — | 12 | — | — | |||||||||||||||||
| Intangible asset | — | 10 | — | 8 | — | — | ||||||||||||||||||
| Accumulated other comprehensive loss | — | 366 | — | 23 | 14 | — | ||||||||||||||||||
| Net asset (liability) recognized at end of fiscal year | $ | (321 | ) | $ | 79 | $ | (113 | ) | $ | (69 | ) | $ | (372 | ) | $ | (381 | ) | |||||||
| (1) | Effective February 3, 2007, the Company adopted SFAS No. 158. |
A-62
NOTESTO CONSOLIDATED FINANCIAL STATEMENTS, CONTINUED
| Pension Benefits | |||||||||||||||||||||||||||
|---|---|---|---|---|---|---|---|---|---|---|---|---|---|---|---|---|---|---|---|---|---|---|---|---|---|---|---|
| Qualified Plans | Non-Qualified Plan | Other Benefits | |||||||||||||||||||||||||
| 2005 | 2004 | 2005 | 2004 | 2005 | 2004 | ||||||||||||||||||||||
| Change in benefit obligation: | |||||||||||||||||||||||||||
| Benefit obligation at beginning of fiscal year | $ | 2,019 | $ | 1,741 | $ | 113 | $ | 103 | $ | 366 | $ | 363 | |||||||||||||||
| Service cost | 118 | 106 | 1 | 1 | 12 | 10 | |||||||||||||||||||||
| Interest cost | 113 | 109 | 6 | 6 | 19 | 21 | |||||||||||||||||||||
| Plan participants’ contributions | — | — | — | — | 9 | 9 | |||||||||||||||||||||
| Amendments | — | — | 3 | — | 4 | (24 | ) | ||||||||||||||||||||
| Actuarial (gain) loss | 145 | 154 | (12 | ) | 7 | (22 | ) | 19 | |||||||||||||||||||
| Benefits paid | (111 | ) | (91 | ) | (6 | ) | (4 | ) | (32 | ) | (32 | ) | |||||||||||||||
| Benefit obligation at end of fiscal year | $ | 2,284 | $ | 2,019 | $ | 105 | $ | 113 | $ | 356 | $ | 366 | |||||||||||||||
| Change in plan assets: | |||||||||||||||||||||||||||
| Fair value of plan assets at beginning of fiscal year | $ | 1,458 | $ | 1,379 | $ | — | $ | — | $ | — | $ | — | |||||||||||||||
| Actual return on plan assets | 167 | 135 | — | — | — | — | |||||||||||||||||||||
| Employer contribution | 300 | 35 | 6 | 4 | 23 | 23 | |||||||||||||||||||||
| Plan participants’ contributions | — | — | — | — | 9 | 9 | |||||||||||||||||||||
| Benefits paid | (111 | ) | (91 | ) | (6 | ) | (4 | ) | (32 | ) | (32 | ) | |||||||||||||||
| Fair value of plan assets at end of fiscal year | $ | 1,814 | $ | 1,458 | $ | — | $ | — | $ | — | $ | — | |||||||||||||||
| Pension Benefits | Other Benefits | ||||||||||||||||||
| Weighted average assumptions | 2006 | 2005 | 2004 | 2006 | 2005 | 2004 | |||||||||||||
| Discount rate – Benefit obligation | 5.90 | % | 5.70 | % | — | 5.90 | % | 5.70 | % | — | |||||||||
| Discount rate – Net periodic benefit cost | 5.70 | % | 5.75 | % | 6.25 | % | 5.70 | % | 5.75 | % | 6.25 | % | |||||||
| Expected return on plan assets | 8.50 | % | 8.50 | % | 8.50 | % | |||||||||||||
| Rate of compensation increase | 3.50 | % | 3.50 | % | 3.50 | % | |||||||||||||
| Pension Benefits | |||||||||||||||||||||||||||
|---|---|---|---|---|---|---|---|---|---|---|---|---|---|---|---|---|---|---|---|---|---|---|---|---|---|---|---|
| Qualified Plans | Non-Qualified Plan | Other Benefits | |||||||||||||||||||||||||
| 2005 | 2004 | 2005 | 2004 | 2005 | 2004 | ||||||||||||||||||||||
| Net liability recognized at end of fiscal year: | |||||||||||||||||||||||||||
| Funded status at end of year | $ | (470 | ) | $ | (561 | ) | $ | (105 | ) | $ | (113 | ) | $ | (356 | ) | $ | (366 | ) | |||||||||
| Unrecognized actuarial (gain) loss | 541 | 457 | 27 | 41 | 23 | 45 | |||||||||||||||||||||
| Unrecognized prior service cost | 9 | 11 | 8 | 11 | (49 | ) | (60 | ) | |||||||||||||||||||
| Unrecognized net transition (asset) obligation | (1 | ) | — | 1 | — | 1 | 1 | ||||||||||||||||||||
| Net liability recognized at end of fiscal year | $ | 79 | $ | (93 | ) | $ | (69 | ) | $ | (61 | ) | $ | (381 | ) | $ | (380 | ) | ||||||||||
| Prepaid benefit cost | $ | — | $ | — | $ | — | $ | — | $ | — | $ | — | |||||||||||||||
| Accrued benefit liability | (217 | ) | (273 | ) | (112 | ) | (103 | ) | (381 | ) | (380 | ) | |||||||||||||||
| Additional minimum liability | (80 | ) | (119 | ) | 12 | (4 | ) | — | — | ||||||||||||||||||
| Intangible asset | 10 | 13 | 8 | 11 | — | — | |||||||||||||||||||||
| Accumulated other comprehensive loss | 366 | 286 | 23 | 35 | — | — | |||||||||||||||||||||
| Net liability recognized at end of fiscal year | $ | 79 | $ | (93 | ) | $ | (69 | ) | $ | (61 | ) | $ | (381 | ) | $ | (380 | ) | ||||||||||
| Pension Benefits | Other Benefits | ||||||||||||||||||||||||||
|---|---|---|---|---|---|---|---|---|---|---|---|---|---|---|---|---|---|---|---|---|---|---|---|---|---|---|---|
| Weighted average assumptions | 2005 | 2004 | 2003 | 2005 | 2004 | 2003 | |||||||||||||||||||||
| Discount rate – Benefit obligation | 5.70 | % | 5.75 | % | — | 5.70 | % | 5.75 | % | — | |||||||||||||||||
| Discount rate – Net periodic benefit cost | 5.75 | % | 6.25 | % | 6.75 | % | 5.75 | % | 6.25 | % | 6.75 | % | |||||||||||||||
| Expected return on plan assets | 8.50 | % | 8.50 | % | 8.50 | % | |||||||||||||||||||||
| Rate of compensation increase | 3.50 | % | 3.50 | % | 3.50 | % | |||||||||||||||||||||
| Pension Benefits | |||||||||||||||||||||||||||||||||||||||
|---|---|---|---|---|---|---|---|---|---|---|---|---|---|---|---|---|---|---|---|---|---|---|---|---|---|---|---|---|---|---|---|---|---|---|---|---|---|---|---|
| Qualified Plans | Non-Qualified Plan | Other Benefits | |||||||||||||||||||||||||||||||||||||
| 2005 | 2004 | 2003 | 2005 | 2004 | 2003 | 2005 | 2004 | 2003 | |||||||||||||||||||||||||||||||
| Components of net periodic benefit cost: | |||||||||||||||||||||||||||||||||||||||
| Service cost | $ | 118 | $ | 106 | $ | 99 | $ | 1 | $ | 1 | $ | 1 | $ | 12 | $ | 10 | $ | 8 | |||||||||||||||||||||
| Interest cost | 113 | 109 | 101 | 6 | 6 | 6 | 19 | 21 | 21 | ||||||||||||||||||||||||||||||
| Expected return on plan assets | (130 | ) | (121 | ) | (122 | ) | — | — | — | — | — | — | |||||||||||||||||||||||||||
| Amortization of: | |||||||||||||||||||||||||||||||||||||||
| Transition asset | (1 | ) | (1 | ) | (1 | ) | — | — | — | — | — | — | |||||||||||||||||||||||||||
| Prior service cost | 3 | 3 | 3 | 2 | 2 | 2 | (7 | ) | (5 | ) | (5 | ) | |||||||||||||||||||||||||||
| Actuarial (gain) loss | 24 | 9 | — | 2 | 3 | 3 | — | — | — | ||||||||||||||||||||||||||||||
| Net periodic benefit cost | $ | 127 | $ | 105 | $ | 80 | $ | 11 | $ | 12 | $ | 12 | $ | 24 | $ | 26 | $ | 24 | |||||||||||||||||||||
| Pension Benefits | |||||||||||||||||||||||||||||||||
| Qualified Plans | Non-Qualified Plan | Other Benefits | |||||||||||||||||||||||||||||||
| 2006 | 2005 | 2004 | 2006 | 2005 | 2004 | 2006 | 2005 | 2004 | |||||||||||||||||||||||||
| Components of net periodic | |||||||||||||||||||||||||||||||||
| benefit cost: | |||||||||||||||||||||||||||||||||
| Service cost | $ | 123 | $ | 118 | $ | 106 | $ | 2 | $ | 1 | $ | 1 | $ | 13 | $ | 12 | $ | 10 | |||||||||||||||
| Interest cost | 130 | 113 | 109 | 6 | 6 | 6 | 20 | 19 | 21 | ||||||||||||||||||||||||
| Expected return on plan assets | (152 | ) | (130 | ) | (121 | ) | — | — | — | — | — | — | |||||||||||||||||||||
| Amortization of: | |||||||||||||||||||||||||||||||||
| Transition asset | (1 | ) | (1 | ) | (1 | ) | — | — | — | — | — | — | |||||||||||||||||||||
| Prior service cost | 3 | 3 | 3 | 2 | 2 | 2 | (7 | ) | (7 | ) | (5 | ) | |||||||||||||||||||||
| Actuarial (gain) loss | 41 | 24 | 9 | 2 | 2 | 3 | — | — | — | ||||||||||||||||||||||||
| Curtailment charge | 5 | — | — | — | — | — | — | — | — | ||||||||||||||||||||||||
| Net periodic benefit cost | $ | 149 | $ | 127 | $ | 105 | $ | 12 | $ | 11 | $ | 12 | $ | 26 | $ | 24 | $ | 26 | |||||||||||||||
| Qualified Plans | Non-Qualified Plan | |||||||||||
| 2006 | 2005 | 2006 | 2005 | |||||||||
| PBO at end of fiscal year | $ | 2,419 | $ | 2,284 | $ | 113 | $ | 105 | ||||
| ABO at end of fiscal year | $ | 2,232 | $ | 2,111 | $ | 103 | $ | 100 | ||||
| Fair value of plan assets at end of year | $ | 2,098 | $ | 1,814 | $ | — | $ | — | ||||
| Qualified Plans | Non-Qualified Plan | ||||||||||||||||||
|---|---|---|---|---|---|---|---|---|---|---|---|---|---|---|---|---|---|---|---|
| 2005 | 2004 | 2005 | 2004 | ||||||||||||||||
| PBO at end of fiscal year | $ | 2,284 | $ | 2,019 | $ | 105 | $ | 113 | |||||||||||
| ABO at end of fiscal year | $ | 2,111 | $ | 1,851 | $ | 100 | $ | 106 | |||||||||||
| Fair value of plan assets at end of year | $ | 1,814 | $ | 1,458 | $ | — | $ | — | |||||||||||
| Pension | Other | |||
| Benefits | Benefits | |||
| 2007 | $139 | $ | 22 | |
| 2008 | $138 | $ | 23 | |
| 2009 | $145 | $ | 24 | |
| 2010 | $142 | $ | 26 | |
| 2011 | $137 | $ | 27 | |
| 2012 - 2016 | $775 | $ | 152 | |
The Company discontinued the accrual of additional benefits under the Company’s cash balance formula of the Consolidated Retirement Benefit Plan (the “Cash Balance Plan”) effective January 1, 2007. Participants in the Cash Balance Plan will continue to earn interest credits on their accrued benefit balance as of December 31, 2006, based on average Treasury rates, but will no longer accrue cash balance pay credits under the Cash Balance Plan after December 31, 2006. Projected pension benefit payments, as noted above, are lower than estimates in prior years as a result of the discontinuation of benefit accruals under the Cash Balance Plan. As a result of the decision to discontinue accruing additional benefits under the Cash Balance Plan, the Company recorded a charge totaling $5, pre-tax, which represented the previously unrecognized prior service costs.
A-64
NOTESTOCONSOLIDATED FINANCIALSTATEMENTS, CONTINUED
| Pension Benefits | Other Benefits | |||||||||
|---|---|---|---|---|---|---|---|---|---|---|
| 2006 | $ | 139 | $ | 21 | ||||||
| 2007 | $ | 147 | $ | 22 | ||||||
| 2008 | $ | 154 | $ | 23 | ||||||
| 2009 | $ | 162 | $ | 24 | ||||||
| 2010 | $ | 161 | $ | 25 | ||||||
| 2011–2015 | $ | 978 | $ | 141 | ||||||
The following table provides information about the target and actual pension plan asset allocations. Allocation percentages are shown as of December 31 for each respective year. The pension plan measurement date is the December 31st31st nearest the fiscal year-end.
| Target | ||||||||
| allocations | Actualallocations | |||||||
| 2006 | 2006 | 2005 | ||||||
| Pension plan asset allocation, as of December 31: | ||||||||
| Domestic equity securities | 21.4 | % | 21.1 | % | 36.1 | % | ||
| International equity securities | 24.5 | 27.5 | 25.2 | |||||
| Investment grade debt securities | 25.0 | 23.3 | 17.8 | |||||
| High yield debt securities | 8.0 | 7.7 | 7.6 | |||||
| Private equity | 5.0 | 4.9 | 4.2 | |||||
| Hedge funds | 7.6 | 7.4 | 3.8 | |||||
| Real estate | 1.5 | 1.4 | 1.1 | |||||
| Other | 7.0 | 6.7 | 4.3 | |||||
| Total | 100.0 | % | 100.0 | % | 100.0 | % | ||
| Target allocations | Actual allocations | ||||||||||||||
|---|---|---|---|---|---|---|---|---|---|---|---|---|---|---|---|
| 2005 | 2005 | 2004 | |||||||||||||
| Pension plan asset allocation, as of December 31: | |||||||||||||||
| Domestic equity securities | 38.0 | % | 36.1 | % | 39.5 | % | |||||||||
| International equity securities | 23.0 | 25.2 | 25.1 | ||||||||||||
| Investment grade debt securities | 18.0 | 17.8 | 18.6 | ||||||||||||
| High yield debt securities | 8.0 | 7.6 | 8.2 | ||||||||||||
| Private equity | 4.5 | 4.2 | 3.8 | ||||||||||||
| Hedge funds | 4.0 | 3.8 | 2.3 | ||||||||||||
| Real estate | 1.5 | 1.1 | 0.5 | ||||||||||||
| Other | 3.0 | 4.3 | 2.0 | ||||||||||||
| Total | 100.0 | % | 100.0 | % | 100.0 | % | |||||||||
A-65
NOTESTO CONSOLIDATED FINANCIAL STATEMENTS, CONTINUED
The measurement date for post-retirement benefit obligations is the December 31st nearest the fiscal year-end. Assumed health care cost trend rates have a significant effect on the amounts reported for the health care plans. The Company used a 9.00% initial health care cost trend rate and a 5.00% ultimate health care cost trend rate to determine its expense. A one-percentage-point change in the assumed health care cost trend rates would have the following effects:
| 1% PointIncrease | 1% PointDecrease | |||||
| Effect on total of service and interest cost components | $ | 5 | $ | (4 | ) | |
| Effect on postretirement benefit obligation | $ | 45 | $ | (39 | ) | |
| 1% Point Increase | 1% Point Decrease | |||||||||
|---|---|---|---|---|---|---|---|---|---|---|
| Effect on total of service and interest cost components | $ | 4 | $ | (3 | ) | |||||
| Effect on postretirement benefit obligation | $ | 41 | $ | (35 | ) | |||||
A-66
18. RECENTLY ISSUED ACCOUNTINGNOTESTOCONSOLIDATEDFINANCIALSTANDARDSTATEMENTS, CONTINUED
In December 2004, the FASB issued SFAS No. 123 (Revised 2004)2002),Share-Based Payment (“SFAS No. 123R”123(R)”), which replacesreplaced SFAS No. 123, supersedessuperseded APB No. 25 and related interpretations and amendsamended SFAS No. 95,, Statement of Cash Flows. The provisions of SFAS No. 123R are similar to those of SFAS No. 123; however, SFAS No. 123RNo 123(R) requires all share-based payments to employees, including grants of employee stock options, to be recognized in the financial statements as compensation cost based on their fair value on the date of grant. Fair valueThe Company adopted the provisions of share-based awards will be determined using option pricing models (e.g. Black-Scholes or binomial models) and assumptions that appropriately reflectSFAS No. 123(R) in the specific circumstancesfirst quarter of 2006. The implementation of SFAS No. 123(R) reduced net earnings $0.06 per diluted share in 2006. See Note 10 for further discussion of the awards. Compensation cost will be recognized over the vesting period based on the fair value of awards that actually vest.
In May 2005,June 2006, the FASB issued Interpretation (“FIN”) No. 48,Accounting for Uncertainty in Income Taxes-an interpretation of FASB Statement No. 109. FIN No. 48 prescribes a recognition threshold and measurement attribute for the financial statement recognition and measurement of a tax position taken or expected to be taken in a tax return. This Interpretation also provides guidance on derecognition, classification, interest and penalties, accounting in interim periods, disclosure and transition. FIN No. 48 becomes effective for the Company’s fiscal year beginning February 4, 2007. The Company is evaluating the effect the implementation of FIN No. 48 will have on its Consolidated Financial Statements.
In September 2006, the FASB issued SFAS No. 154,157,Accounting Changes and Error Corrections, a replacement of APB Opinion No. 20 and FASB Statement No. 3.Fair Value Measurement. SFAS No. 154 requires retrospective application to prior periods financial statements157 defines fair value, establishes a framework for changesmeasuring fair value in accounting principle, unless it is impracticable to determine either the period-specific effects or the cumulative effect of the change.GAAP and expands disclosures about fair value measurement. SFAS No. 154 also requires that retrospective application of a change in accounting principle be limited to the direct effects of the change. Indirect effects of a change in accounting principle should be recognized in the period of the accounting change.157 does not require any new fair value measurements. SFAS No. 154 further requires a change in depreciation, amortization or depletion method for long-lived, non-financial assets to be accounted for as a change in accounting estimate effected by a change in accounting principle. SFAS No. 154157 will become effective for the Company’s fiscal year beginning January 29, 2006.February 3, 2008. The Company is evaluating the effect the implementation of SFAS No. 157 will have on its Consolidated Financial Statements.
A-67
NOTESTO CONSOLIDATED FINANCIAL STATEMENTS, CONTINUED
In November 2004,June 2006, the FASB ratified the consensus of Emerging Issues Task Force (“EITF”) reached a consensus on EITF Issueissue No. 04-10, “Determining Whether06-03,How Taxes Get Collected from Customers and Remitted to Aggregate Operating Segments That Do Not MeetGovernmental Authorities Should Be Presented in the Quantitative Thresholds.”Income Statement (That Is, Gross versus Net Presentation). EITF No. 04-10
Condensed Consolidating
Balance Sheets
As of February 3, 2007
| Guarantor | |||||||||||||||
| The Kroger Co. | Subsidiaries | Eliminations | Consolidated | ||||||||||||
| Current assets | |||||||||||||||
| Cash | $ 25 | $ 164 | $ — | $ 189 | |||||||||||
| Store deposits in-transit | 69 | 545 | — | 614 | |||||||||||
| Receivables | 168 | 1,982 | (1,372 | ) | 778 | ||||||||||
| Net inventories | 406 | 4,203 | — | 4,609 | |||||||||||
| Prepaid and other current assets | 371 | 194 | — | 565 | |||||||||||
| Total current assets | 1,039 | 7,088 | (1,372 | ) | 6,755 | ||||||||||
| Property, plant and equipment, net | 1,429 | 10,350 | — | 11,779 | |||||||||||
| Goodwill, net | 56 | 2,136 | — | 2,192 | |||||||||||
| Other assets | 647 | 1,149 | (1,307 | ) | 489 | ||||||||||
| Investment in and advances to subsidiaries | 11,510 | — | (11,510 | ) | — | ||||||||||
| Total Assets | $ 14,681 | $ 20,723 | $ (14,189 | ) | $ 21,215 | ||||||||||
| Current liabilities | |||||||||||||||
| Current portion of long-term debt | |||||||||||||||
| including obligations under capital | |||||||||||||||
| leases and financing obligations | $ 906 | $ — | $ — | $ 906 | |||||||||||
| Accounts payable | 1,614 | 4,869 | (2,679 | ) | 3,804 | ||||||||||
| Other current liabilities | (537 | ) | 3,408 | — | 2,871 | ||||||||||
| Total current liabilities | 1,983 | 8,277 | (2,679 | ) | 7,581 | ||||||||||
| Long-term debt including obligations under | |||||||||||||||
| capital leases and financing obligations | |||||||||||||||
| Face value long-term debt including | |||||||||||||||
| obligations under capital leases and | |||||||||||||||
| financing obligations | 6,136 | — | — | 6,136 | |||||||||||
| Adjustment to reflect fair value interest rate | |||||||||||||||
| hedges | 18 | — | — | 18 | |||||||||||
| Long-term debt including obligations | |||||||||||||||
| under capital leases and financing | |||||||||||||||
| obligations | 6,154 | — | — | 6,154 | |||||||||||
| Other long-term liabilities | 1,621 | 936 | — | 2,557 | |||||||||||
| Total Liabilities | 9,758 | 9,213 | (2,679 | ) | 16,292 | ||||||||||
| Shareowners’ Equity | 4,923 | 11,510 | (11,510 | ) | 4,923 | ||||||||||
| Total Liabilities and Shareowners’ equity | $ 14,681 | $ 20,723 | $ (14,189 | ) | $ 21,215 | ||||||||||
A-69
NOTESTOCONSOLIDATEDFINANCIALSTATEMENTS, CONTINUED
Condensed Consolidating
Balance Sheets
As of January 28, 2006
| Guarantor | ||||||||||||||
| The Kroger Co. | Subsidiaries | Eliminations | Consolidated | |||||||||||
| Current assets | ||||||||||||||
| Cash | $ 39 | $ 171 | $ — | $ 210 | ||||||||||
| Store deposits in-transit | 46 | 442 | — | 488 | ||||||||||
| Receivables | 1,088 | 526 | (928 | ) | 686 | |||||||||
| Net inventories | 460 | 4,026 | — | 4,486 | ||||||||||
| Prepaid and other current assets | 355 | 241 | — | 596 | ||||||||||
| Total current assets | 1,988 | 5,406 | (928 | ) | 6,466 | |||||||||
| Property, plant and equipment, net | 1,255 | 10,110 | — | 11,365 | ||||||||||
| Goodwill, net | 56 | 2,136 | — | 2,192 | ||||||||||
| Other assets | (509 | ) | 968 | — | 459 | |||||||||
| Investment in and advances to subsidiaries | 10,808 | — | (10,808 | ) | — | |||||||||
| Total Assets | $ 13,598 | $ 18,620 | $ (11,736 | ) | $ 20,482 | |||||||||
| Current liabilities | ||||||||||||||
| Current portion of long-term debt | ||||||||||||||
| including obligations under capital | ||||||||||||||
| leases and financing obligations | 554 | $ — | $ — | $ 554 | ||||||||||
| Accounts payable | 263 | 4,215 | (928 | ) | 3,550 | |||||||||
| Other current liabilities | (151 | ) | 2,762 | — | 2,611 | |||||||||
| Total current liabilities | 666 | 6,977 | (928 | ) | 6,715 | |||||||||
| Long-term debt including obligations under | ||||||||||||||
| capital leases and financing obligations | ||||||||||||||
| Face value long-term debt including | ||||||||||||||
| obligations under capital leases and | ||||||||||||||
| financing obligations | 6,651 | — | — | 6,651 | ||||||||||
| Adjustment to reflect fair value interest rate | ||||||||||||||
| hedges | 27 | — | — | 27 | ||||||||||
| Long-term debt including obligations | ||||||||||||||
| under capital leases and financing | ||||||||||||||
| obligations | 6,678 | — | — | 6,678 | ||||||||||
| Other long-term liabilities | 1,864 | 835 | — | 2,699 | ||||||||||
| Total Liabilities | 9,208 | 7,812 | (928 | ) | 16,092 | |||||||||
| Shareowners’ Equity | 4,390 | 10,808 | (10,808 | ) | 4,390 | |||||||||
| Total Liabilities and Shareowners’ equity | $ 13,598 | $ 18,620 | $ (11,736 | ) | $ 20,482 | |||||||||
| The Kroger Co. | Guarantor Subsidiaries | Eliminations | Consolidated | |||||||||||||||
|---|---|---|---|---|---|---|---|---|---|---|---|---|---|---|---|---|---|---|
| Current assets | ||||||||||||||||||
| Cash | $ | 39 | $ | 171 | $ | — | $ | 210 | ||||||||||
| Store deposits in-transit | 46 | 442 | — | 488 | ||||||||||||||
| Receivables | 1,088 | 526 | (928 | ) | 686 | |||||||||||||
| Net inventories | 460 | 4,026 | — | 4,486 | ||||||||||||||
| Prepaid and other current assets | 355 | 241 | — | 596 | ||||||||||||||
| Total current assets | 1,988 | 5,406 | (928 | ) | 6,466 | |||||||||||||
| Property, plant and equipment, net | 1,255 | 10,110 | — | 11,365 | ||||||||||||||
| Goodwill, net | 56 | 2,136 | — | 2,192 | ||||||||||||||
| Other assets | (509 | ) | 968 | — | 459 | |||||||||||||
| Investment in and advances to subsidiaries | 10,808 | — | (10,808 | ) | — | |||||||||||||
| Total Assets | $ | 13,598 | $ | 18,620 | $ | (11,736 | ) | $ | 20,482 | |||||||||
| Current liabilities | ||||||||||||||||||
| Current portion of long-term debt including obligations under capital leases and financing obligations | $ | 554 | $ | — | $ | — | $ | 554 | ||||||||||
| Accounts payable | 263 | 4,215 | (928 | ) | 3,550 | |||||||||||||
| Other current liabilities | (151 | ) | 2,762 | — | 2,611 | |||||||||||||
| Total current liabilities | 666 | 6,977 | (928 | ) | 6,715 | |||||||||||||
| Long-term debt including obligations under capital leases and financing obligations | ||||||||||||||||||
| Face value long-term debt including obligations under capital leases and financing obligations | 6,651 | — | — | 6,651 | ||||||||||||||
| Adjustment to reflect fair value interest rate hedges | 27 | — | — | 27 | ||||||||||||||
| Long-term debt including obligations under capital leases and financing obligations | 6,678 | — | — | 6,678 | ||||||||||||||
| Other long-term liabilities | 1,864 | 835 | — | 2,699 | ||||||||||||||
| Total Liabilities | 9,208 | 7,812 | (928 | ) | 16,092 | |||||||||||||
| Shareowners’ Equity | 4,390 | 10,808 | (10,808 | ) | 4,390 | |||||||||||||
| Total Liabilities and Shareowners’ equity | $ | 13,598 | $ | 18,620 | $ | (11,736 | ) | $ | 20,482 | |||||||||
For the Year ended February 3, 2007
| The Kroger Co. | Guarantor Subsidiaries | Eliminations | Consolidated | |||||||||||||||
|---|---|---|---|---|---|---|---|---|---|---|---|---|---|---|---|---|---|---|
| Current assets | ||||||||||||||||||
| Cash | $ | 32 | $ | 112 | $ | — | $ | 144 | ||||||||||
| Store deposits in-transit | 20 | 486 | — | 506 | ||||||||||||||
| Receivables | 583 | 747 | (502 | ) | 828 | |||||||||||||
| Net inventories | 415 | 3,941 | — | 4,356 | ||||||||||||||
| Prepaid and other current assets | 275 | 297 | — | 572 | ||||||||||||||
| Total current assets | 1,325 | 5,583 | (502 | ) | 6,406 | |||||||||||||
| Property, plant and equipment, net | 1,277 | 10,220 | — | 11,497 | ||||||||||||||
| Goodwill, net | 20 | 2,171 | — | 2,191 | ||||||||||||||
| Other assets | 642 | (245 | ) | — | 397 | |||||||||||||
| Investment in and advances to subsidiaries | 10,668 | — | (10,668 | ) | — | |||||||||||||
| Total assets | $ | 13,932 | $ | 17,729 | $ | (11,170 | ) | $ | 20,491 | |||||||||
| Current liabilities | ||||||||||||||||||
| Current portion of long-term debt including obligations under capital leases and financing obligations | $ | 71 | $ | — | $ | — | $ | 71 | ||||||||||
| Accounts payable | 188 | 3,912 | (502 | ) | 3,598 | |||||||||||||
| Other current liabilities | 319 | 2,347 | — | 2,666 | ||||||||||||||
| Total current liabilities | 578 | 6,259 | (502 | ) | 6,335 | |||||||||||||
| Long-term debt including obligations under capital leases and financing obligations | ||||||||||||||||||
| Face value long-term debt including obligations under capital leases and financing obligations | 7,797 | 33 | — | 7,830 | ||||||||||||||
| Adjustment to reflect fair value interest rate hedges | 70 | — | — | 70 | ||||||||||||||
| Long-term debt including obligations under capital leases and financing obligations | 7,867 | 33 | — | 7,900 | ||||||||||||||
| Other long-term liabilities | 1,868 | 769 | — | 2,637 | ||||||||||||||
| Total liabilities | 10,313 | 7,061 | (502 | ) | 16,872 | |||||||||||||
| Shareowners’ Equity | 3,619 | 10,668 | (10,668 | ) | 3,619 | |||||||||||||
| Total liabilities and shareowners’ equity | $ | 13,932 | $ | 17,729 | $ | (11,170 | ) | $ | 20,491 | |||||||||
| Guarantor | |||||||||||||||
| The Kroger Co. | Subsidiaries | Eliminations | Consolidated | ||||||||||||
| Sales | $8,731 | $58,383 | $(1,003 | ) | $66,111 | ||||||||||
| Merchandise costs, including warehousing | |||||||||||||||
| and transportation | 6,630 | 44,488 | (1,003 | ) | 50,115 | ||||||||||
| Operating, general and administrative | 1,697 | 10,142 | — | 11,839 | |||||||||||
| Rent | 132 | 517 | — | 649 | |||||||||||
| Depreciation and amortization | 136 | 1,136 | — | 1,272 | |||||||||||
| Operating profit | 136 | 2,100 | — | 2,236 | |||||||||||
| Interest expense | 480 | 8 | — | 488 | |||||||||||
| Equity in earnings of subsidiaries | 1,843 | — | (1,843 | ) | — | ||||||||||
| Earnings before tax expense | 1,499 | 2,092 | (1,843 | ) | 1,748 | ||||||||||
| Tax expense | 384 | 249 | — | 633 | |||||||||||
| Net earnings | $1,115 | $ 1,843 | $(1,843 | ) | $ 1,115 | ||||||||||
Statements of Operations
For the Year ended January 28, 2006
| The Kroger Co. | Guarantor Subsidiaries | Eliminations | Consolidated | |||||||||||||||
|---|---|---|---|---|---|---|---|---|---|---|---|---|---|---|---|---|---|---|
| Sales | $ | 8,693 | $ | 52,822 | $ | (962 | ) | $ | 60,553 | |||||||||
| Merchandise costs, including warehousing and transportation | 6,502 | 40,021 | (958 | ) | 45,565 | |||||||||||||
| Operating, general and administrative | 1,657 | 9,368 | 2 | 11,027 | ||||||||||||||
| Rent | 165 | 502 | (6 | ) | 661 | |||||||||||||
| Depreciation and amortization | 139 | 1,126 | — | 1,265 | ||||||||||||||
| Operating profit | 230 | 1,805 | — | 2,035 | ||||||||||||||
| Interest expense | 498 | 12 | — | 510 | ||||||||||||||
| Equity in earnings of subsidiaries | 1,164 | — | (1,164 | ) | — | |||||||||||||
| Earnings (loss) before tax expense | 896 | 1,793 | (1,164 | ) | 1,525 | |||||||||||||
| Tax expense (benefit) | (62 | ) | 629 | — | 567 | |||||||||||||
| Net earnings (loss) | $ | 958 | $ | 1,164 | $ | (1,164 | ) | $ | 958 | |||||||||
| Guarantor | |||||||||||||||
| The Kroger Co. | Subsidiaries | Eliminations | Consolidated | ||||||||||||
| Sales | $8,693 | $ 52,822 | $ (962 | ) | $ 60,553 | ||||||||||
| Merchandise costs, including warehousing | |||||||||||||||
| and transportation | 6,502 | 40,021 | (958 | ) | 45,565 | ||||||||||
| Operating, general and administrative | 1,657 | 9,368 | 2 | 11,027 | |||||||||||
| Rent | 165 | 502 | (6 | ) | 661 | ||||||||||
| Depreciation and amortization | 139 | 1,126 | — | 1,265 | |||||||||||
| Operating profit | 230 | 1,805 | — | 2,035 | |||||||||||
| Interest expense | 498 | 12 | — | 510 | |||||||||||
| Equity in earnings of subsidiaries | 1,164 | — | (1,164 | ) | — | ||||||||||
| Earnings before tax expense | 896 | 1,793 | (1,164 | ) | 1,525 | ||||||||||
| Tax expense (benefit) | (62 | ) | 629 | — | 567 | ||||||||||
| Net earnings | $ 958 | $ 1,164 | $ (1,164 | ) | $ 958 | ||||||||||
Statements of Operations
For the Year ended January 29, 2005
| The Kroger Co. | Guarantor Subsidiaries | Non-Guarantor Subsidiaries | Eliminations | Consolidated | ||||||||||||||||||
|---|---|---|---|---|---|---|---|---|---|---|---|---|---|---|---|---|---|---|---|---|---|---|
| Sales | $ | 8,003 | $ | 49,432 | $ | 41 | $ | (1,042 | ) | $ | 56,434 | |||||||||||
| Merchandise costs, including warehousing and transportation | 6,420 | 36,721 | — | (1,001 | ) | 42,140 | ||||||||||||||||
| Operating, general and administrative | 1,126 | 9,494 | (9 | ) | — | 10,611 | ||||||||||||||||
| Rent | 194 | 527 | — | (41 | ) | 680 | ||||||||||||||||
| Depreciation and amortization | 110 | 1,142 | 4 | — | 1,256 | |||||||||||||||||
| Goodwill impairment charge | — | 904 | — | — | 904 | |||||||||||||||||
| Operating profit | 153 | 644 | 46 | — | 843 | |||||||||||||||||
| Interest expense | 529 | 6 | 22 | — | 557 | |||||||||||||||||
| Equity in earnings of subsidiaries | 430 | — | — | (430 | ) | — | ||||||||||||||||
| Earnings (loss) before tax expense | 54 | 638 | 24 | (430 | ) | 286 | ||||||||||||||||
| Tax expense (benefit) | 158 | 231 | 1 | — | 390 | |||||||||||||||||
| Net earnings (loss) | $ | (104 | ) | $ | 407 | $ | 23 | $ | (430 | ) | $ | (104 | ) | |||||||||
| Guarantor | Non-Guarantor | ||||||||||||||||||
| The Kroger Co. | Subsidiaries | Subsidiaries | Eliminations | Consolidated | |||||||||||||||
| Sales | $8,003 | $49,432 | $41 | $(1,042 | ) | $56,434 | |||||||||||||
| Merchandise costs, including | |||||||||||||||||||
| warehousing and | |||||||||||||||||||
| transportation | 6,420 | 36,721 | — | (1,001 | ) | 42,140 | |||||||||||||
| Operating, general and | |||||||||||||||||||
| administrative | 1,126 | 9,494 | (9 | ) | — | 10,611 | |||||||||||||
| Rent | 194 | 527 | — | (41 | ) | 680 | |||||||||||||
| Depreciation and amortization | 110 | 1,142 | 4 | — | 1,256 | ||||||||||||||
| Goodwill impairment charge | — | 904 | — | — | 904 | ||||||||||||||
| Operating profit | 153 | 644 | 46 | — | 843 | ||||||||||||||
| Interest expense | 529 | 6 | 22 | — | 557 | ||||||||||||||
| Equity in earnings of subsidiaries | 430 | — | — | (430 | ) | — | |||||||||||||
| Earnings before tax expense | 54 | 638 | 24 | (430 | ) | 286 | |||||||||||||
| Tax expense | 158 | 231 | 1 | — | 390 | ||||||||||||||
| Net earnings (loss) | $ (104 | ) | $ 407 | $23 | $ (430 | ) | $ (104 | ) | |||||||||||
Condensed Consolidating
Statements of Operations
For the Year ended February 3, 2007
| Guarantor | |||||||||||
| The Kroger Co. | Subsidiaries | Consolidated | |||||||||
| Net cash provided by operating activities | $ 152 | $ 2,199 | $ 2,351 | ||||||||
| Cash flows from investing activities: | |||||||||||
| Capital expenditures | (143 | ) | (1,540 | ) | (1,683 | ) | |||||
| Other | 56 | 40 | 96 | ||||||||
| Net cash used by investing activities | (87 | ) | (1,500 | ) | (1,587 | ) | |||||
| Cash flows from financing activities: | |||||||||||
| Proceeds from issuance of long-term debt | 362 | — | 362 | ||||||||
| Reductions in long-term debt | (556 | ) | — | (556 | ) | ||||||
| Proceeds from issuance of capital stock | 168 | — | 168 | ||||||||
| Capital stock reacquired | (633 | ) | — | (633 | ) | ||||||
| Dividends paid | (140 | ) | — | (140 | ) | ||||||
| Other | 18 | (4 | ) | 14 | |||||||
| Net change in advances to subsidiaries | 702 | (702 | ) | — | |||||||
| Net cash used by financing activities | (79 | ) | (706 | ) | (785 | ) | |||||
| Net decrease in cash and temporary cash investments | (14 | ) | (7 | ) | (21 | ) | |||||
| Cash and temporary investments: | |||||||||||
| Beginning of year | 39 | 171 | 210 | ||||||||
| End of year | $ 25 | $ 164 | $ 189 | ||||||||
A-74
NOTESTOOTESTOCONSOLIDATEDFINANCIALSTATEMENTS, CONTINUED
Condensed Consolidating
Statements of Operations
For the Year ended January 28, 2006
| Guarantor | |||||||||||
| The Kroger Co. | Subsidiaries | Consolidated | |||||||||
| Net cash provided by operating activities | $ 1,171 | $ 1,021 | $ 2,192 | ||||||||
| Cash flows from investing activities: | |||||||||||
| Capital expenditures | (188 | ) | (1,118 | ) | (1,306 | ) | |||||
| Other | 11 | 16 | 27 | ||||||||
| Net cash used by investing activities | (177 | ) | (1,102 | ) | (1,279 | ) | |||||
| Cash flows from financing activities: | |||||||||||
| Proceeds from issuance of long-term debt | 14 | — | 14 | ||||||||
| Reductions in long-term debt | (764 | ) | (33 | ) | (797 | ) | |||||
| Proceeds from issuance of capital stock | 78 | — | 78 | ||||||||
| Capital stock reacquired | (252 | ) | — | (252 | ) | ||||||
| Other | 77 | 33 | 110 | ||||||||
| Net change in advances to subsidiaries | (140 | ) | 140 | — | |||||||
| Net cash provided (used) by financing activities | (987 | ) | 140 | (847 | ) | ||||||
| Net increase in cash and temporary cash investments | 7 | 59 | 66 | ||||||||
| Cash and temporary investments: | |||||||||||
| Beginning of year | 32 | 112 | 144 | ||||||||
| End of year | $ 39 | $ 171 | $ 210 | ||||||||
A-75
NOTESTOCONSOLIDATEDFINANCIALSTATEMENTS, CONTINUED
Condensed Consolidating
Statements of Operations
For the Year ended January 31, 200429, 2005
| The Kroger Co. | Guarantor Subsidiaries | Non-Guarantor Subsidiaries | Eliminations | Consolidated | ||||||||||||||||||
|---|---|---|---|---|---|---|---|---|---|---|---|---|---|---|---|---|---|---|---|---|---|---|
| Sales | $ | 6,935 | $ | 47,752 | $ | 45 | $ | (941 | ) | $ | 53,791 | |||||||||||
| Merchandise costs, including warehousing and transportation | 5,583 | 34,943 | — | (889 | ) | 39,637 | ||||||||||||||||
| Operating, general and administrative | 1,305 | 9,060 | (11 | ) | — | 10,354 | ||||||||||||||||
| Rent | 168 | 541 | — | (52 | ) | 657 | ||||||||||||||||
| Depreciation and amortization | 91 | 1,114 | 4 | — | 1,209 | |||||||||||||||||
| Goodwill impairment charge | — | 471 | — | — | 471 | |||||||||||||||||
| Asset impairment charge | — | 120 | — | — | 120 | |||||||||||||||||
| Operating profit (loss) | (212 | ) | 1,503 | 52 | — | 1,343 | ||||||||||||||||
| Interest expense | 568 | 15 | 21 | — | 604 | |||||||||||||||||
| Equity in earnings of subsidiaries | 939 | — | — | (939 | ) | — | ||||||||||||||||
| Earnings (loss) before tax expense | 159 | 1,488 | 31 | (939 | ) | 739 | ||||||||||||||||
| Tax expense (benefit) | (126 | ) | 571 | 9 | — | 454 | ||||||||||||||||
| Net earnings (loss) | $ | 285 | $ | 917 | $ | 22 | $ | (939 | ) | $ | 285 | |||||||||||
| Guarantor | |||||||||||
| The Kroger Co. | Subsidiaries | Consolidated | |||||||||
| Net cash provided by operating activities | $ (890 | ) | $ 3,220 | $ 2,330 | |||||||
| Cash flows from investing activities: | |||||||||||
| Capital expenditures | (161 | ) | (1,473 | ) | (1,634 | ) | |||||
| Other | 22 | 4 | 26 | ||||||||
| Net cash used by investing activities | (139 | ) | (1,469 | ) | (1,608 | ) | |||||
| Cash flows from financing activities: | |||||||||||
| Proceeds from issuance of long-term debt | 616 | — | 616 | ||||||||
| Reductions in long-term debt | (724 | ) | (286 | ) | (1,010 | ) | |||||
| Proceeds from issuance of capital stock | 25 | — | 25 | ||||||||
| Capital stock reacquired | (319 | ) | — | (319 | ) | ||||||
| Other | (27 | ) | (22 | ) | (49 | ) | |||||
| Net change in advances to subsidiaries | 1,464 | (1,464 | ) | — | |||||||
| Net cash provided (used) by financing activities | 1,035 | (1,772 | ) | (737 | ) | ||||||
| Net (decrease) increase in cash and temporary cash | |||||||||||
| investments | 6 | (21 | ) | (15 | ) | ||||||
| Cash and temporary investments: | |||||||||||
| Beginning of year | 26 | 133 | 159 | ||||||||
| End of year | $ 32 | $ 112 | $ 144 | ||||||||
| Quarter | |||||||||||||||||||
| First | Second | Third | Fourth | Total Year | |||||||||||||||
| 2006 | (16 Weeks) | (12 Weeks) | (12 Weeks) | (13 Weeks) | (53 Weeks) | ||||||||||||||
| Sales | $ | 19,415 | $ | 15,138 | $ | 14,699 | $ | 16,859 | $ | 66,111 | |||||||||
| Net earnings | $ | 306 | $ | 209 | $ | 215 | $ | 385 | $ | 1,115 | |||||||||
| Net earnings per basic common share | $ | 0.42 | $ | 0.29 | $ | 0.30 | $ | 0.55 | $ | 1.56 | |||||||||
| Average number of shares used in basic | |||||||||||||||||||
| calculation | 722 | 719 | 712 | 706 | 715 | ||||||||||||||
| Net earnings per diluted common share | $ | 0.42 | $ | 0.29 | $ | 0.30 | $ | 0.54 | $ | 1.54 | |||||||||
| Average number of shares used in diluted | |||||||||||||||||||
| calculation | 729 | 725 | 720 | 715 | 723 | ||||||||||||||
| Quarter | |||||||||||||||||||
| First | Second | Third | Fourth | Total Year | |||||||||||||||
| 2005 | (16 Weeks) | (12 Weeks) | (12 Weeks) | (12 Weeks) | (52 Weeks) | ||||||||||||||
| Sales | $ | 17,948 | $ | 13,865 | $ | 14,020 | $ | 14,720 | $ | 60,553 | |||||||||
| Net earnings | $ | 294 | $ | 196 | $ | 185 | $ | 283 | $ | 958 | |||||||||
| Net earnings per basic common share | $ | 0.40 | $ | 0.27 | $ | 0.26 | $ | 0.39 | $ | 1.32 | |||||||||
| Average number of shares used in basic | |||||||||||||||||||
| calculation | 727 | 722 | 724 | 724 | 724 | ||||||||||||||
| Net earnings per diluted common share | $ | 0.40 | $ | 0.27 | $ | 0.25 | $ | 0.39 | $ | 1.31 | |||||||||
| Average number of shares used in diluted | |||||||||||||||||||
| calculation | 732 | 730 | 732 | 730 | 731 | ||||||||||||||
CONSOLIDATED FINANCIAL STATEMENTS, CONTINUED
ERTIFICATIONS
| The Kroger Co. | Guarantor Subsidiaries | Consolidated | ||||||||||||
|---|---|---|---|---|---|---|---|---|---|---|---|---|---|---|
| Net cash provided by operating activities | $ | 1,171 | $ | 1,021 | $ | 2,192 | ||||||||
| Cash flows from investing activities: | ||||||||||||||
| Capital expenditures | (188 | ) | (1,118 | ) | (1,306 | ) | ||||||||
| Other | 11 | 16 | 27 | |||||||||||
| Net cash used by investing activities | (177 | ) | (1,102 | ) | (1,279 | ) | ||||||||
| Cash flows from financing activities: | ||||||||||||||
| Proceeds from issuance of long-term debt | 14 | — | 14 | |||||||||||
| Reductions in long-term debt | (764 | ) | (33 | ) | (797 | ) | ||||||||
| Proceeds from issuance of capital stock | 78 | — | 78 | |||||||||||
| Capital stock reacquired | (252 | ) | — | (252 | ) | |||||||||
| Other | 77 | 33 | 110 | |||||||||||
| Net change in advances to subsidiaries | (140 | ) | 140 | — | ||||||||||
| Net cash provided (used) by financing activities | (987 | ) | 140 | (847 | ) | |||||||||
| Net (decrease) increase in cash and temporary cash investments | 7 | 59 | 66 | |||||||||||
| Cash and temporary investments: | ||||||||||||||
| Beginning of year | 32 | 112 | 144 | |||||||||||
| End of year | $ | 39 | $ | 171 | $ | 210 | ||||||||
| The Kroger Co. | Guarantor Subsidiaries | Consolidated | ||||||||||||
|---|---|---|---|---|---|---|---|---|---|---|---|---|---|---|
| Net cash provided by operating activities | $ | (890 | ) | $ | 3,220 | $ | 2,330 | |||||||
| Cash flows from investing activities: | ||||||||||||||
| Capital expenditures | (161 | ) | (1,473 | ) | (1,634 | ) | ||||||||
| Other | 22 | 4 | 26 | |||||||||||
| Net cash used by investing activities | (139 | ) | (1,469 | ) | (1,608 | ) | ||||||||
| Cash flows from financing activities: | ||||||||||||||
| Proceeds from issuance of long-term debt | 616 | — | 616 | |||||||||||
| Reductions in long-term debt | (724 | ) | (286 | ) | (1,010 | ) | ||||||||
| Proceeds from issuance of capital stock | 25 | — | 25 | |||||||||||
| Capital stock reacquired | (319 | ) | — | (319 | ) | |||||||||
| Other | (27 | ) | (22 | ) | (49 | ) | ||||||||
| Net change in advances to subsidiaries | 1,464 | (1,464 | ) | — | ||||||||||
| Net cash provided (used) by financing activities | 1,035 | (1,772 | ) | (737 | ) | |||||||||
| Net (decrease) increase in cash and temporary cash investments | 6 | (21 | ) | (15 | ) | |||||||||
| Cash and temporary investments: | ||||||||||||||
| Beginning of year | 26 | 133 | 159 | |||||||||||
| End of year | $ | 32 | $ | 112 | $ | 144 | ||||||||
| The Kroger Co. | Guarantor Subsidiaries | Consolidated | ||||||||||||
|---|---|---|---|---|---|---|---|---|---|---|---|---|---|---|
| Net cash provided by operating activities | $ | 385 | $ | 1,830 | $ | 2,215 | ||||||||
| Cash flows from investing activities: | ||||||||||||||
| Capital expenditures | (176 | ) | (1,824 | ) | (2,000 | ) | ||||||||
| Other | (59 | ) | 33 | (26 | ) | |||||||||
| Net cash used by investing activities | (235 | ) | (1,791 | ) | (2,026 | ) | ||||||||
| Cash flows from financing activities: | ||||||||||||||
| Proceeds from issuance of long-term debt | 247 | 100 | 347 | |||||||||||
| Reductions in long-term debt | (347 | ) | (140 | ) | (487 | ) | ||||||||
| Proceeds from issuance of capital stock | 39 | — | 39 | |||||||||||
| Proceeds from interest rate swap terminations | 114 | — | 114 | |||||||||||
| Capital stock reacquired | (301 | ) | — | (301 | ) | |||||||||
| Other | (23 | ) | 110 | 87 | ||||||||||
| Net change in advances to subsidiaries | 104 | (104 | ) | — | ||||||||||
| Net cash provided (used) by financing activities | (167 | ) | (34 | ) | (201 | ) | ||||||||
| Net (decrease) increase in cash and temporary cash investments | (17 | ) | 5 | (12 | ) | |||||||||
| Cash and temporary investments: | ||||||||||||||
| Beginning of year | 43 | 128 | 171 | |||||||||||
| End of year | $ | 26 | $ | 133 | $ | 159 | ||||||||
| Quarter | ||||||||||||||||||||||
|---|---|---|---|---|---|---|---|---|---|---|---|---|---|---|---|---|---|---|---|---|---|---|
| 2005 | | First (16 Weeks) | | Second (12 Weeks) | | Third (12 Weeks) | | Fourth (12 Weeks) | | Total Year (52 Weeks) | ||||||||||||
Sales | $ | 17,948 | $ | 13,865 | $ | 14,020 | $ | 14,720 | $ | 60,553 | ||||||||||||
Net earnings | $ | 294 | $ | 196 | $ | 185 | $ | 283 | $ | 958 | ||||||||||||
Net earnings per basic common share | $ | 0.40 | $ | 0.27 | $ | 0.26 | $ | 0.39 | $ | 1.32 | ||||||||||||
Average number of shares used in basic calculation | 727 | 722 | 724 | 724 | 724 | |||||||||||||||||
Net earnings per diluted common share | $ | 0.40 | $ | 0.27 | $ | 0.25 | $ | 0.39 | $ | 1.31 | ||||||||||||
Average number of shares used in diluted calculation | 732 | 730 | 732 | 730 | 731 | |||||||||||||||||
| 2004 | | First (16 Weeks) | | Second (12 Weeks) | | Third (12 Weeks) | | Fourth (12 Weeks) | | Total Year (52 Weeks) | ||||||||||||
|---|---|---|---|---|---|---|---|---|---|---|---|---|---|---|---|---|---|---|---|---|---|---|
| Sales | $ | 16,905 | $ | 12,980 | $ | 12,854 | $ | 13,695 | $ | 56,434 | ||||||||||||
| Net earnings (loss) | $ | 263 | $ | 142 | $ | 143 | $ | (652 | ) | $ | (104 | ) | ||||||||||
| Net earnings (loss) per basic common share | $ | 0.35 | $ | 0.19 | $ | 0.19 | $ | (0.89 | ) | $ | (0.14 | ) | ||||||||||
| Average number of shares used in basic calculation | 741 | 737 | 736 | 730 | 736 | |||||||||||||||||
| Net earnings (loss) per diluted common share | $ | 0.35 | $ | 0.19 | $ | 0.19 | $ | (0.89 | ) | $ | (0.14 | ) | ||||||||||
| Average number of shares used in diluted calculation | 749 | 744 | 742 | 730 | 736 | |||||||||||||||||
Kroger has a variety of plans under which employees may acquire common stock of Kroger. Employees of Kroger and its subsidiaries own shares through a profit sharing plan, as well as 401(k) plans and a payroll deduction plan called the Kroger Stock Exchange. If employees have questions concerning their shares in the Kroger Stock Exchange, or if they wish to sell shares they have purchased through this plan, they should contact: |
| The Bank of New York |
| Employee Investment Plans Division |
| P. O. Box 1089 |
| Newark, New Jersey 07101 |
| Toll Free 1-800-872-3307 |
Questions regarding Kroger’s 401(k) plan should be directed to the employee’s Human Resources Department or 1-800-2KROGER. Questions concerning any of the other plans should be directed to the employee’s Human Resources Department. SHAREOWNERS: The Bank of New York is Registrar and Transfer Agent for Kroger’s Common Stock. For questions concerning payment of dividends, changes of address, etc., individual shareowners should contact: |
| Written Shareholder inquiries: | Certificate transfer and address changes: | ||||||
| The Bank of New York | The Bank of New York | ||||||
| Shareholder Relations Department | Receive and Deliver Department | ||||||
| P.O. Box 11258 | P.O. Box 11002 | ||||||
| Church Street Station | Church Street Station | ||||||
| New York, New York 10286 | New York, New York 10286 | ||||||
| The Bank’s toll-free number is: 1-800-405-6566. E-mail: shareowners@bankofny.com |
Shareholder questions and requests for forms available on the Internet should be directed to: http://www.stockbny.com |
FINANCIAL INFORMATION: Call (513) 762-1220 to request printed financial information, including Kroger’s most recent report on Form 10-Q or 10-K, or press release. Written inquiries should be addressed to Shareholder Relations, The Kroger Co., 1014 Vine Street, Cincinnati, Ohio 45202-1100. Information also is available on Kroger’s corporate website at www.thekrogerco.com. |
| EXECUTIVEOFFICERS | |||||||||||||||||||||||||||||||||||||||||||||||||||||||||||||||||||||||||||||||||||||||||||||||||||||||||||||||||||||||||||||||||||||||||||||||||||||||||||||||||||||||||||||||||||||||||||||||||||||||||||||||||||||||||||||||||||||||||||||||||||||||||||||||||||||||||||||||||||||||||||||||||||||||||||||||||||||||||||||||||||||||||||||||||||||||||||||||||||||||||||||||||||||||||||||||||||||||||||||||||||||||||||||||||||||||||||||||||||||||||||||||||||||||||||||||||||||||||||||||||||||||||||||||||||||||||||||||||||||||||||||||||||||||||||||||||||||||||||||||||||||||||||||||||||||||||||||||||||||||||||||||||||||
| Donald E. Becker | Paul W. Heldman | W. Rodney McMullen | |||||||||||||||||||||||||||||||||||||||||||||||||||||||||||||||||||||||||||||||||||||||||||||||||||||||||||||||||||||||||||||||||||||||||||||||||||||||||||||||||||||||||||||||||||||||||||||||||||||||||||||||||||||||||||||||||||||||||||||||||||||||||||||||||||||||||||||||||||||||||||||||||||||||||||||||||||||||||||||||||||||||||||||||||||||||||||||||||||||||||||||||||||||||||||||||||||||||||||||||||||||||||||||||||||||||||||||||||||||||||||||||||||||||||||||||||||||||||||||||||||||||||||||||||||||||||||||||||||||||||||||||||||||||||||||||||||||||||||||||||||||||||||||||||||||||||||||||||||||||||||||||||||
| Executive Vice President | Executive Vice President, | Vice Chairman | |||||||||||||||||||||||||||||||||||||||||||||||||||||||||||||||||||||||||||||||||||||||||||||||||||||||||||||||||||||||||||||||||||||||||||||||||||||||||||||||||||||||||||||||||||||||||||||||||||||||||||||||||||||||||||||||||||||||||||||||||||||||||||||||||||||||||||||||||||||||||||||||||||||||||||||||||||||||||||||||||||||||||||||||||||||||||||||||||||||||||||||||||||||||||||||||||||||||||||||||||||||||||||||||||||||||||||||||||||||||||||||||||||||||||||||||||||||||||||||||||||||||||||||||||||||||||||||||||||||||||||||||||||||||||||||||||||||||||||||||||||||||||||||||||||||||||||||||||||||||||||||||||||
| Secretary and General Counsel | |||||||||||||||||||||||||||||||||||||||||||||||||||||||||||||||||||||||||||||||||||||||||||||||||||||||||||||||||||||||||||||||||||||||||||||||||||||||||||||||||||||||||||||||||||||||||||||||||||||||||||||||||||||||||||||||||||||||||||||||||||||||||||||||||||||||||||||||||||||||||||||||||||||||||||||||||||||||||||||||||||||||||||||||||||||||||||||||||||||||||||||||||||||||||||||||||||||||||||||||||||||||||||||||||||||||||||||||||||||||||||||||||||||||||||||||||||||||||||||||||||||||||||||||||||||||||||||||||||||||||||||||||||||||||||||||||||||||||||||||||||||||||||||||||||||||||||||||||||||||||||||||||||||
| William T. Boehm | M. Marnette Perry | ||||||||||||||||||||||||||||||||||||||||||||||||||||||||||||||||||||||||||||||||||||||||||||||||||||||||||||||||||||||||||||||||||||||||||||||||||||||||||||||||||||||||||||||||||||||||||||||||||||||||||||||||||||||||||||||||||||||||||||||||||||||||||||||||||||||||||||||||||||||||||||||||||||||||||||||||||||||||||||||||||||||||||||||||||||||||||||||||||||||||||||||||||||||||||||||||||||||||||||||||||||||||||||||||||||||||||||||||||||||||||||||||||||||||||||||||||||||||||||||||||||||||||||||||||||||||||||||||||||||||||||||||||||||||||||||||||||||||||||||||||||||||||||||||||||||||||||||||||||||||||||||||||||
| Senior Vice President | Scott M. Henderson | Senior Vice President | |||||||||||||||||||||||||||||||||||||||||||||||||||||||||||||||||||||||||||||||||||||||||||||||||||||||||||||||||||||||||||||||||||||||||||||||||||||||||||||||||||||||||||||||||||||||||||||||||||||||||||||||||||||||||||||||||||||||||||||||||||||||||||||||||||||||||||||||||||||||||||||||||||||||||||||||||||||||||||||||||||||||||||||||||||||||||||||||||||||||||||||||||||||||||||||||||||||||||||||||||||||||||||||||||||||||||||||||||||||||||||||||||||||||||||||||||||||||||||||||||||||||||||||||||||||||||||||||||||||||||||||||||||||||||||||||||||||||||||||||||||||||||||||||||||||||||||||||||||||||||||||||||||
| President—Manufacturing | Vice President and Treasurer
THEKROGERCO. l 1014 VINESTREETl CINCINNATI, OHIO45202l (513) 762-4000 | ||||||||||||||||||||||||||||||||||||||||||||||||||||||||||||||||||||||||||||||||||||||||||||||||||||||||||||||||||||||||||||||||||||||||||||||||||||||||||||||||||||||||||||||||||||||||||||||||||||||||||||||||||||||||||||||||||||||||||||||||||||||||||||||||||||||||||||||||||||||||||||||||||||||||||||||||||||||||||||||||||||||||||||||||||||||||||||||||||||||||||||||||||||||||||||||||||||||||||||||||||||||||||||||||||||||||||||||||||||||||||||||||||||||||||||||||||||||||||||||||||||||||||||||||||||||||||||||||||||||||||||||||||||||||||||||||||||||||||||||||||||||||||||||||||||||||||||||||||||||||||||||||||||